Fig. 2.

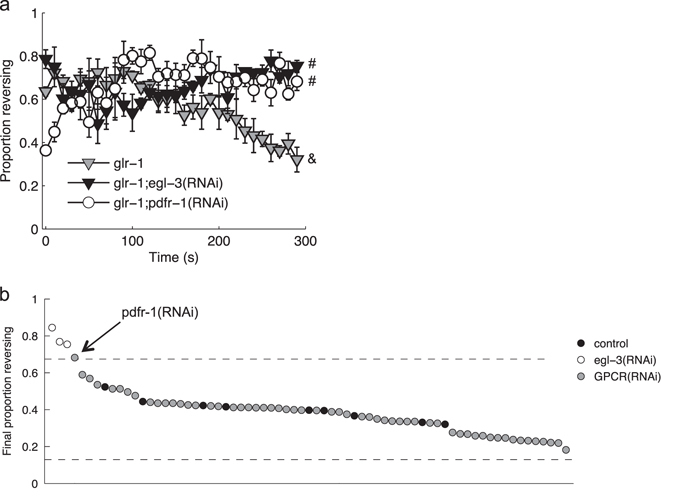
GPCR RNAi screen. a Proportion of the population reversing to each stimulus for animals fed RNAi clones that increased the probability of a reversal to the final stimulus. Mean ±SEM. ‘#’ and ‘&’ denote significantly different groups based on the likelihood of responding to the final stimulus. b Proportion of animals reversing to the final stimulus for populations fed RNAi clones to knockdown egl-3 or one of 57 GPCRs. Knockdown was done in a background sensitized to neuronal RNAi by feeding: glr-1; lin-15b; sid-1; unc-119p::sid-1. Each circle is the mean of three plates, with multiple replicates for the control and egl-3 targeting vector. Dashed lines mark upper and lower critical values (values corresponding to |z-score| > 4.46; P < (0.05/57 =) 0.0008)
