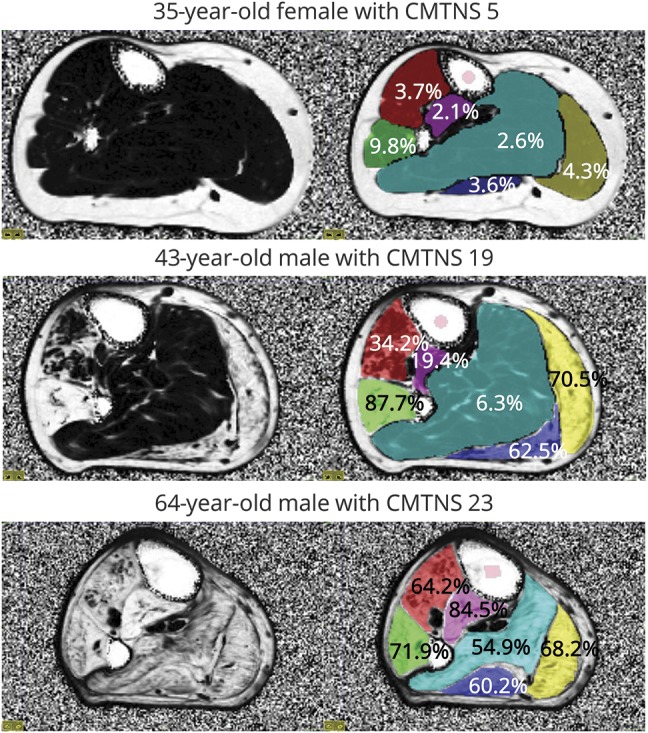
Figure 1. Quantitative MRI in a range of disease severity in Charcot-Marie-Tooth disease type 1A.

Axial fat fraction map of the right calf 130 mm distal to the lateral tibial plateau is shown on the left. Regions of interest (red: tibialis anterior/extensor hallucis longus; green: peroneus longus; purple: tibialis posterior; light blue: soleus; dark blue: lateral gastrocnemius; yellow: medial gastrocnemius) and respective mean fat fraction values are overlaid on the right. In the top patient, there is a slight increase in fat fraction in peroneus longus only. In the middle row, marked involvement is seen with endstage involvement of peroneus longus and both heads of the gastrocnemius. In the bottom row, there is severe involvement of all muscle groups. CMTNS = Charcot-Marie-Tooth Neuropathy Score.
