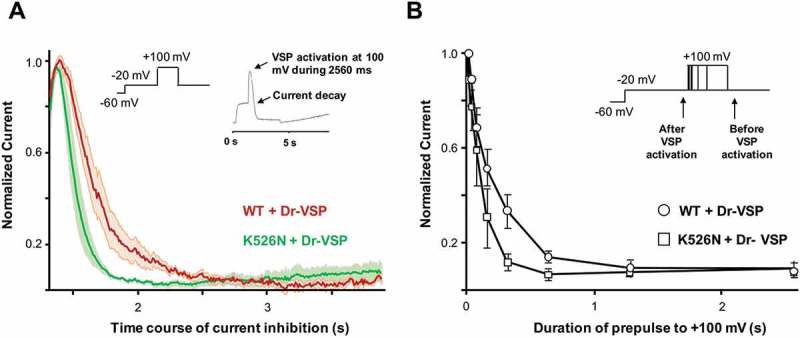
Figure 6.

The K526N channel presents a reduced PIP2 affinity. (a), Averaged time course of the current decline during 2.560 ms of Dr-VSP activation at + 100 mV in cells transfected with WT + Dr-VSP (red, n = 6) or K526N + Dr-VSP (green, n = 6) subunits. The shadows represent the mean ± SEM. (b), Normalized current at 20 mV (after/before step to + 100 mV, see arrows in the inset) for different durations at + 100 mV. Each point represents the mean ± SEM for WT (n = 6) and K526N (n = 6) .
