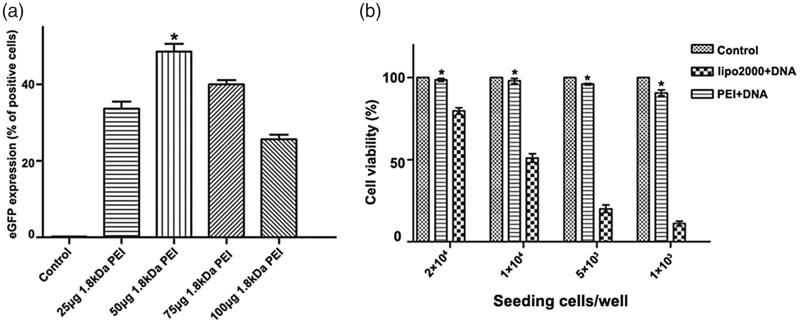
Figure 4.
Optimization of 1.8 kDa PEI working concentration. (a) A2780 cells are transfected by (from left to right) control, 1 μg 25 kDa PEI +1 μg pGFP +25 μg 1.8 kDa PEI, 1 μg 25 kDa PEI +1 μg pGFP +50 μg 1.8 kDa PEI, 1 μg 25 kDa PEI +1 μg pGFP +75 μg 1.8 kDa PEI and 1 μg 25 kDa PEI +1 μg pGFP +100 μg 1.8 kDa PEI, respectively. Gene transfection efficiency for each group is quantified by flow cytometry. (mean ± SD, n = 3, *p < .05 versus control, 25 μg 1.8 kDa pEI, 75 μg 1.8 kDa PEI and 100 μg 1.8 kDa PEI groups) (g). (b) Analysis and comparison of the cytotoxicity of the combined PEI and lipofectamine 2000 under various cell confluences. Different amount of A2780 cells are inoculated in a 96-well plate to acquire various cell confluences. (mean ± SD, n = 3, *p < .05).

