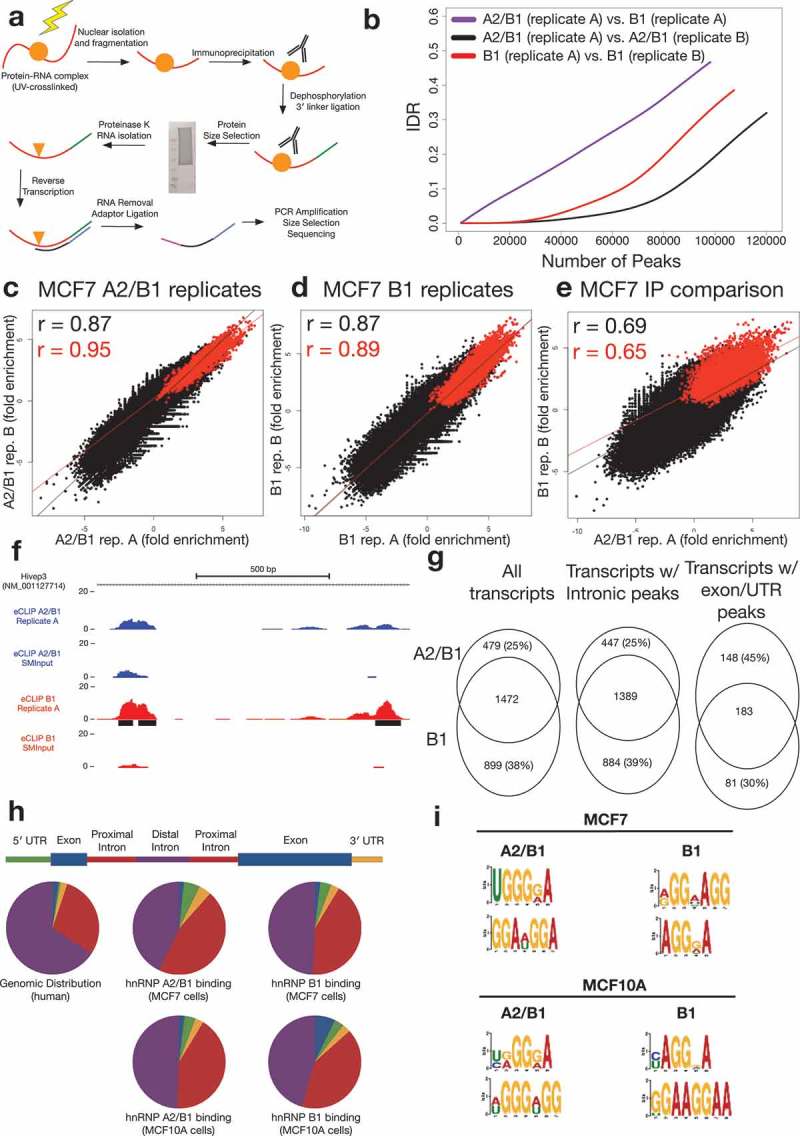
Figure 2.

A2/B1 and B1 eCLIP results in MCF7 cells.
(a) Schematic of the eCLIP protocol(b) Irreproducible Discovery Rate (IDR) analysis comparing peak fold enrichment indicates increased reproducibility for replicates compared against one another (A2/B1, black; B1, red) than comparison of replicates from A2/B1 and B1 experiments (purple).(c) Correlation of A2/B1 eCLIP replicate fold enrichment at non-significant (black) or significant (red) peaks in replicate 1. R values are Pearson’s correlation coefficient.(d) Correlation of B1 eCLIP replicate fold enrichment at non-significant (black) or significant (red) peaks in replicate 1. R values are Pearson’s correlation coefficient.(e) Correlation of A2/B1 and B1 eCLIP fold enrichment at non-significant (black) or significant (red) peaks in A2/B1. R values are Pearson’s correlation coefficient.(f) Example hnRNP A2/B1 eCLIP data, demonstrating region of the transcription factor Hivep3 that contains binding sites (black) enriched specifically in hnRNP B1 (blue). Y-axis scale is normalized to reads per million. Region pictured is chr1:42,345,550–42,344,700.(g) Analysis of RefSeq transcripts containing input normalized peaks in both replicates of A2/B1 or B1 eCLIP-seq experiments. Also pictured are analyses of transcripts that contain peaks only in introns or exons/UTRs.(h) Distribution of peaks (conserved between both replicates) in different areas of transcripts in hnRNP A2/B1 and B1 eCLIP experiments, compared to experiments performed in non-tumorigenic MCF10A cells. ‘Proximal introns’ are defined as intronic regions within 2 kb of an exon.(i) Top two identified motifs in both replicates of hnRNP A2/B1 and B1 eCLIPs in MCF7 and MCF10A cells.
