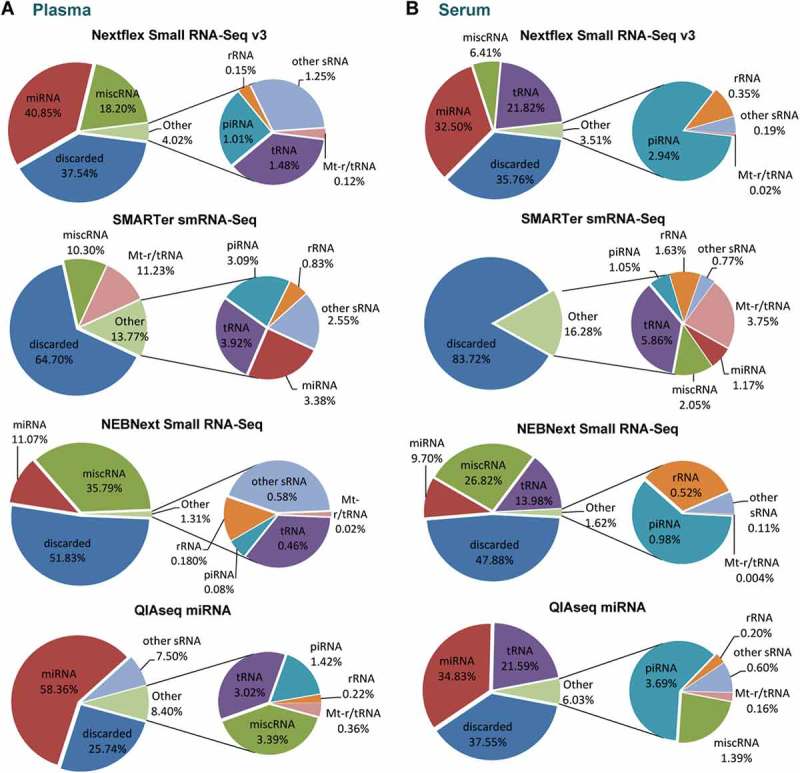
Figure 3.

Small RNA library composition by biotype for human plasma and serum samples.
Pie charts analysis of the mean percentages of mapped sRNA reads from (a) human plasma and (b) human serum. Mapped reads were sorted into the following ncRNA biotype classes: miRNA, tRNA, rRNA, piRNA, mt-t/rRNA, other sRNA (snoRNA, snRNA, scaRNA and scRNA) and miscRNA (vt-RNA and YRNA). Mapped reads that did not align to ncRNA genes in the human genome were classified as ‘not aligned’. Lowly abundant sRNAs biotypes were combined in the charts as ‘Others’. n = 2 biological replicates for plasma and serum respectively, pie charts show mean percentage.
