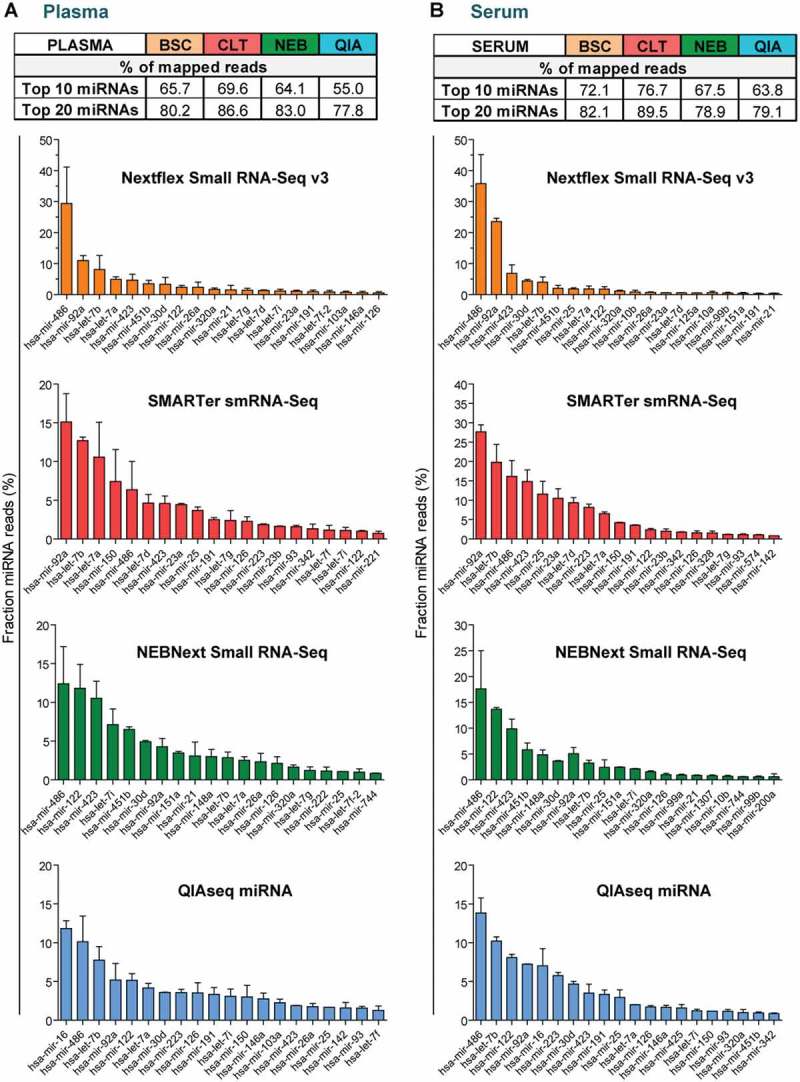
Figure 4.

miRNA signatures in human plasma and serum samples.
Overview of the miRNAs with the highest count numbers in each library for (a) human plasma and (b) human serum. The table indicates the percentage of sequencing reads accounting for the top 10 or top 20 most abundant miRNAs respectively (mean normalized frequencies used). Bar charts indicate the mean percentage of reads associated with the 20 most abundant miRNAs separated by biofluid and kit. Typically 10 miRNAs were accounting for more than 55% of all miRNA mapping reads. Most libraries were enriched for miRNAs that are typically found in blood-derived samples, such as miR-486. n = 2, values are mean + SD.
