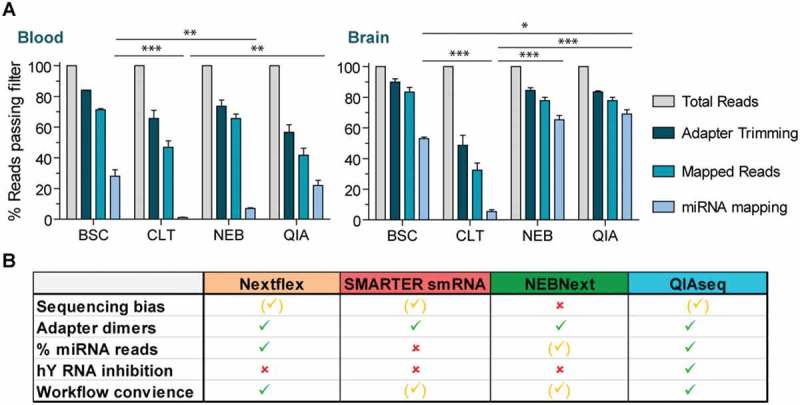
Figure 6.

Summary of sequencing efficiency and overall performance.
(a) To assess sequencing efficiency, the percent of reads passing the filter during adapter trimming and mapping were calculated for each of the four library preparation methodologies. The bar graph indicated the average percentage relative to total reads (corresponds to 100%) for biofluids (combing plasma and serum) and brain libraries. Values are mean + SEM, n = 4 for biofluids, n = 2 for brain. *P < 0.05, **P < 0.01, ***P < 0.001, significance only shown for miRNA mapping reads, one-way ANOVA with Bonferroni post hoc test. Values are mean + SD(b) Summary of the comparison for the sRNA-seq library preparation protocols. Green ticks indicate a satisfying and, yellow ticks an average performance in the respective category. Red crosses either signify a performance below average or in the case of YRNA inhibition, the option is not available.
