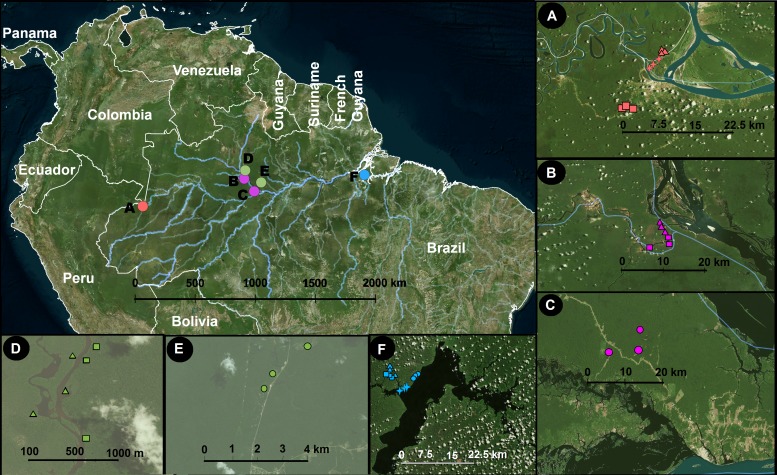
Figure 1. Study area and sampling locations.
Inset panels show details of each locality. A, Benjamin Constant; B, Jaú; C, Jaú, naturally open areas; D, Cuieras; E, Cuieras, naturally open areas; and F, Caxiuanã. The symbols in A–F represent different vegetation types that are linked with different soil properties: circles, open areas; triangles, forest seasonally flooded by black water rivers; squares, unflooded forest; and crosses, forest seasonally flooded by white water rivers. The sampling strategy was designed to cover a wide longitudinal range in Amazonia. The map was constructed using QGIS (2012).

