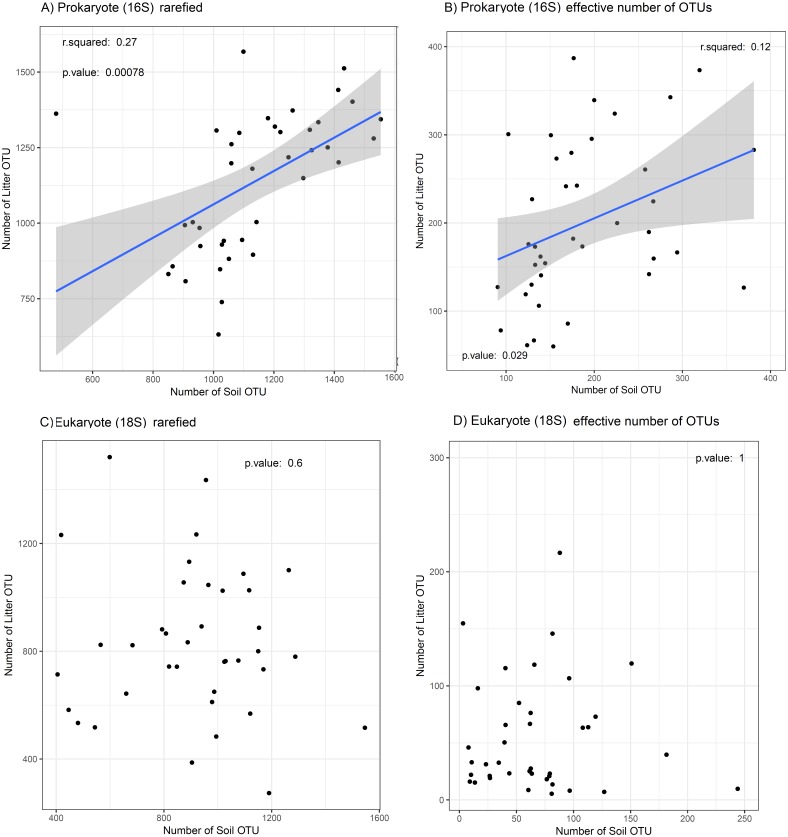
Figure 4. Relation between OTU diversity in soil and litter.
Prokaryotes (16S) are showed in (A) OTU richness and (B) effective number of OTUs; eukaryotes (18S) are showed in (C) OTU richness and (D) effective number of OTUs in the Amazonian soil samples. The blue line shows a linear regression with standard error indicated by the shaded area for significant correlations. The relationship between soil layers (litter vs soil) is weak and differs between taxa, with only prokaryotes showing a significant correlation for richness and effective number of OTUs. This result suggests that it OTU diversity in litter is unsuitable as proxy for the OTU diversity in the soil and vice versa.

