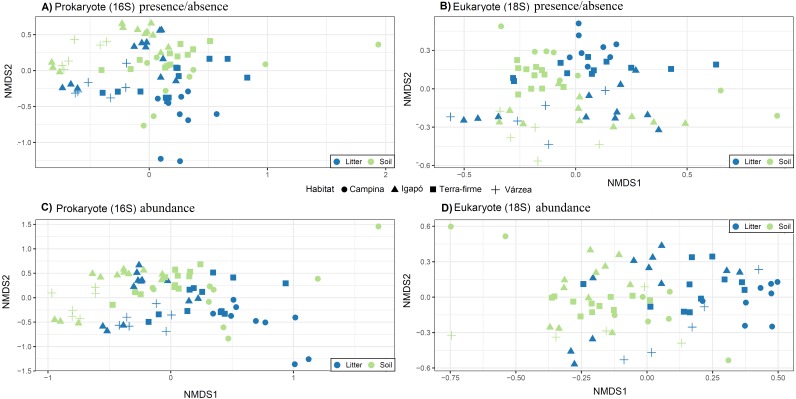
Figure 5. Community structure related to substrate type (litter and soil) and habitat types.
Visualization of differences in OTU composition (measured with the presence/absence matrixes using Jaccard dissimilarity index in A and B; and measured with relative abundance matrixes using Bray-Curtis dissimilarity index) using non-metric multidimensional scaling (NMDS) for (A) and (C) prokaryotes (16S) and (B) and (D) eukaryotes (18S). Symbols represent different habitats. Blue represent litter samples and green soil samples. A small but statistically significant (PERMANOVA test) separation between the substrates can be observed along the second ordination axis for both groups of organisms. The strongest and most significant separation is observed between habitat types.

