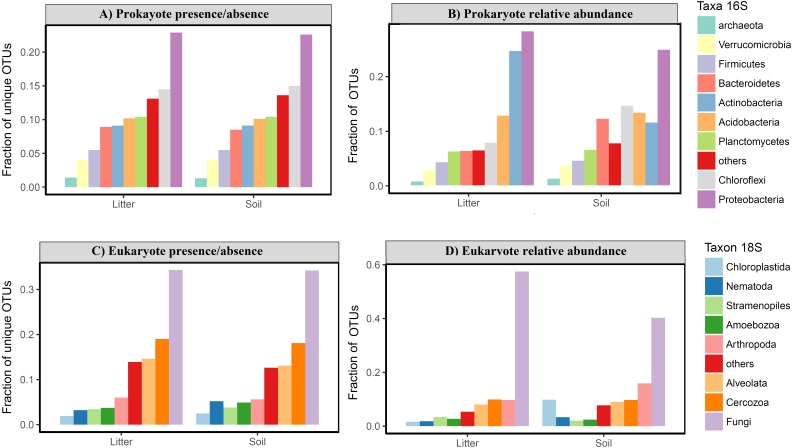
Figure 6. Taxonomic composition of Amazonian soil and litter micro-organismic communities.
The plots show the fraction of OTUs divided by taxonomic group for (A) relative frequency of OTU presence for prokaryotes; (B) relative abundance of OTU for prokaryotes; (C) relative frequency of OTU presence for eukaryotes; (D) relative abundance of OTU for eukaryotes. There is no clear taxonomic variation among groups in litter vs soil, in either the prokaryote or the eukaryote data for presence/absence. The relative abundance data shows a higher frequency of Actinobacteria in litter compared with soil and a higher abundance of Chloroflexi and Bacterioides in soil sample for prokaryotes. For eukaryotes is possible observe a highest relative abundance of Arthropoda and Chloroplastida in soil than litter samples.

