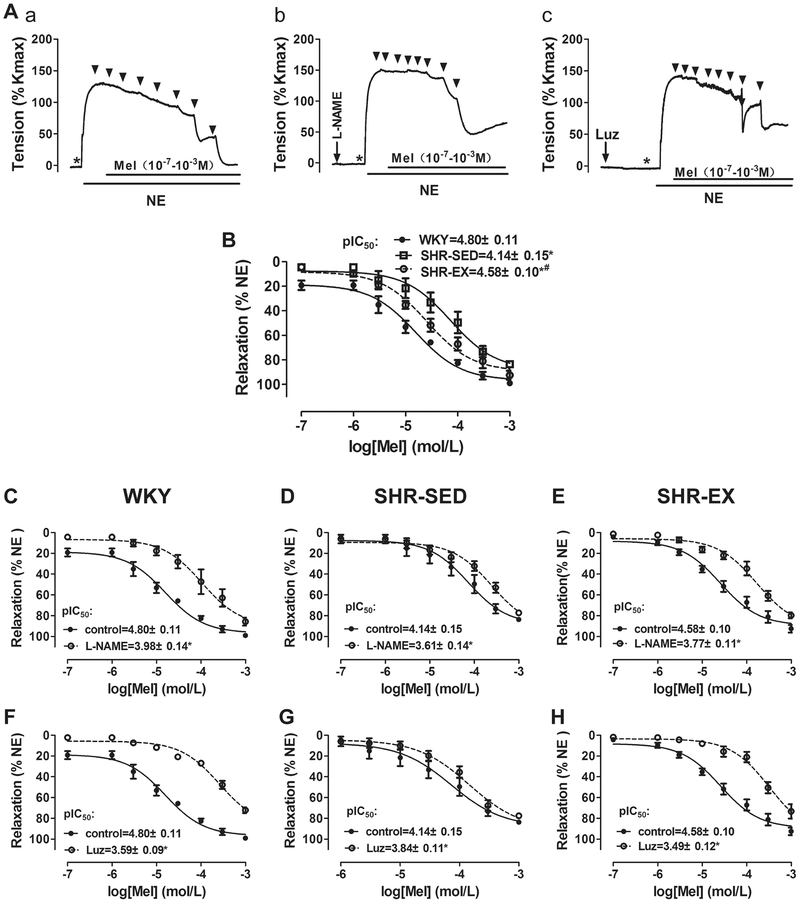
Fig. 2.
Effect of melatonin on NE-induced vessel contraction. A Example of real-time recording of vascular contractility in mesenteric arterial rings in control (a), with L-NAME pretreatment (b), and with Luz pretreatment (c). The dose–response curves of melatonin-induced mesenteric arterial relaxation. B Comparison of dose–response relations of melatonin-induced vasorelaxation in WKY, SHR-SED, and SHR-EX in control (without L-NAME and Luz pretreatment). *P < 0.05, vs. WKY; #P < 0.05, vs. SHR-SED. C–H Cumulative concentration–relaxation (%) curves for melatonin (10−7−10−3 M) in MAs against NE in control, with L-NAME pretreatment, and with Luz pretreatment in WKY (C and F), SHR-SED (D and G), and SHR-EX (E and H). *P < 0.05, vs. control. L-NAME, 10−4 M; Luz, 2 × 10⁻⁶ M, n = 6 in each group

