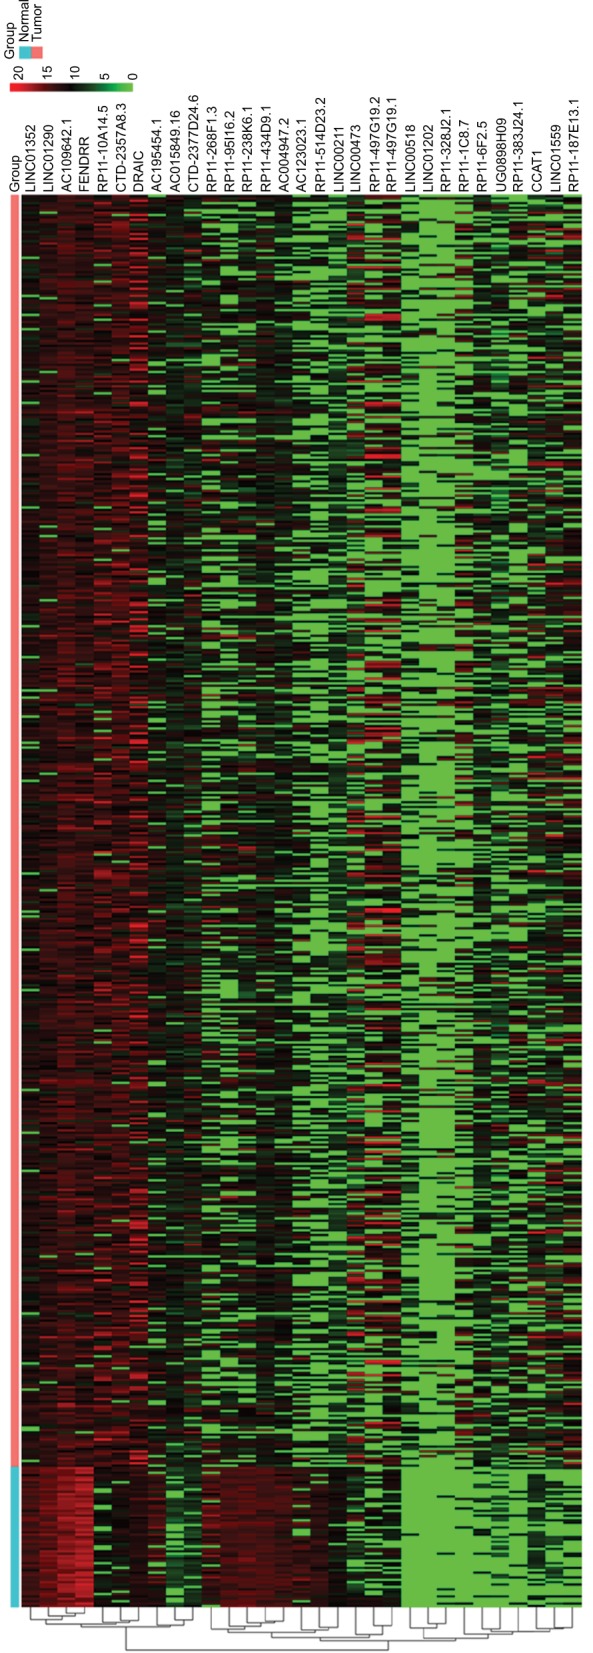
Figure 1.

Hierarchical cluster dendrogram of selected 31 lncRNAs from TCGA LUAD RNA-seq dataset. The left vertical axis shows clusters of lncRNAs. The red rectangular strip in the upper portion of the picture represents normal tissue samples, and the light blue rectangular strip denotes LUAD samples. Red rectangles represent overexpressed genes, and green rectangles represent under-expressed lncRNAs. Black rectangles represent median-expressed lncRNAs.
Abbreviations: TCGA, The Cancer Genome Atlas; LUAD, lung adenocarcinoma; RNA-seq, RNA sequencing.
