
Figure 7: SFCA reduces obesity and immune signaling activation.
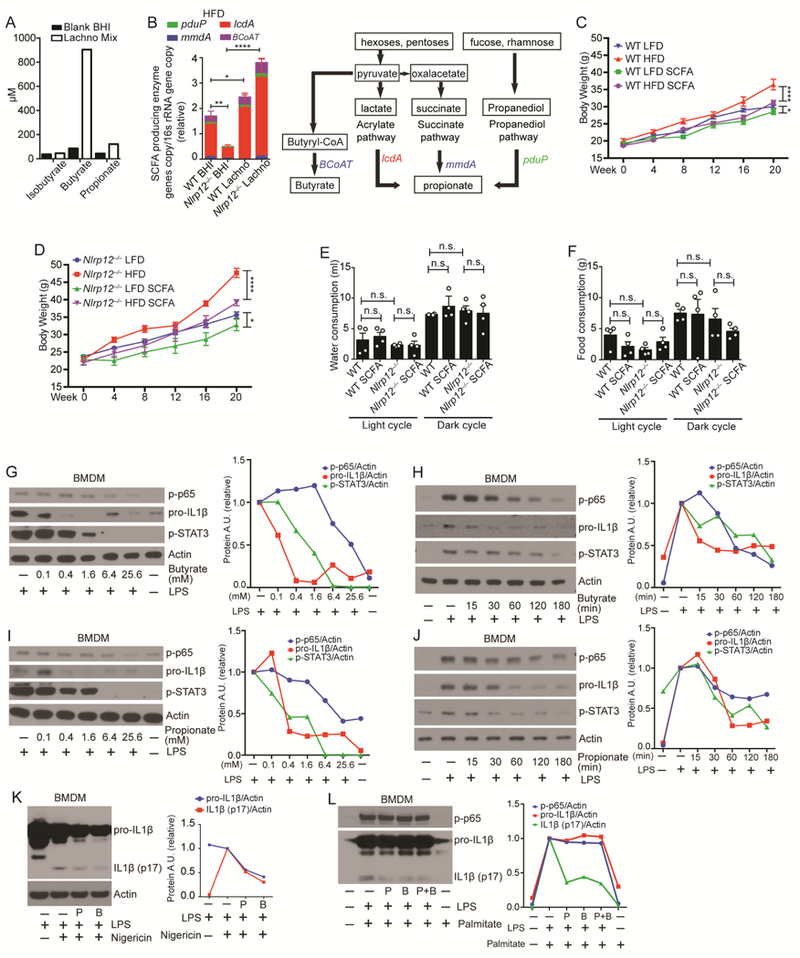
(A) Isobutyrate, butyrate and propionate production by Lachno cultures determined by mass spectrometry. (B) Relative genomic DNA copy number of the key enzymes of propionate and butyrate synthesis normalized to total bacterial 16S rRNA gene copy number in the feces from mice treated with Lachno or BHI (WT Lachno, n=9; Nlrp12-/- Lachno, n=9; WT BHI, n=19; Nlrp12-/- BHI, n=17). Schematic of SCFA propionate and butyrate synthesis pathways utilized by bacteria. (C) Body weight of WT and (D) Nlrp12-/- mice on LFD vs. HFD treated with or without 200mM of propionate and butyrate (SCFAs) in the drinking water (n=5/group). (E) Water and (F) food consumption of WT and Nlrp12-/- mice given HFD with or without SCFAs, and each symbol represents one mouse (n=4/group). (G-J) Dose and kinetic analysis of WT BMDMs pretreated with propionate (P) or butyrate (B) followed by LPS (100 ng/ml) stimulation. Levels of proIL1β, p-p65 and p-STAT3 were measured by western blot analysis with densitometry. (K) Western blot analysis of pro-IL1β, IL1β (p17) and p-p65 in WT BMDMs untreated or treated with 6.4mM of P or B for 1hr followed by 100 ng/ml of LPS and 1μM of nigericin stimulation. (L) Western blot analysis of pro-IL1β, IL1β (p17) and p-p65 in WT BMDMs primed with LPS for 3hr, followed by a 24hr stimulation with 0.2mM of palmitate with or without P or/and B. Error bars show SEM, *p<0.05, **p<0.01 **** p<0.0001 and n.s. means no significance determined by Student’s t test.