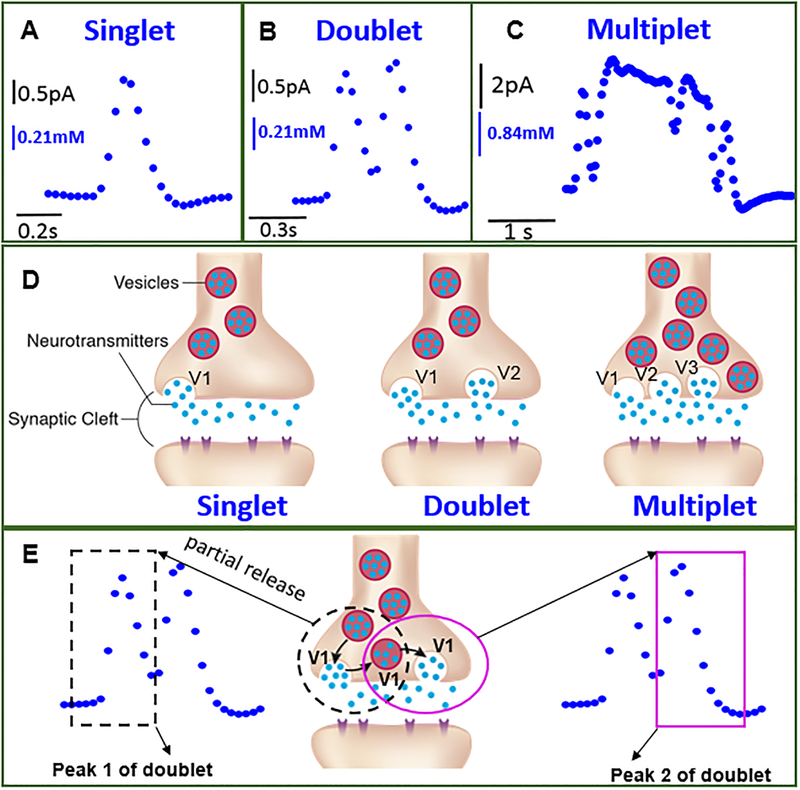
Figure 2.
Single synaptic cholinergic neurotransmission measured in situ. (A-C) Current-time trace (amperometry) representing synaptic transmitter concentration and release dynamics simultaneously, where diverse cholinergic concentration dynamics were observed consisted of singlet (Fig. A), doublet (Fig. B), and multiplet (Fig. C). Single current (concentration) maxima occur during singlet release (50% occurrence frequency out of 16 events total); a second current maximum occurs before the first current peak decreases to the base value for the doublet events (~30% occurrence frequency); multiple concentration peaks (more than two) were observed for multiplet with lower occurrence frequency (~20%) (Fig. S7D). (D) Proposed mechanism on variation in synaptic transmitter release dynamics. Neurotransmitter is released into the synaptic cleft from a single vesicle (Left). Neurotransmitter is released into the synaptic cleft from two vesicles, V1 and V2, simultaneously (Middle) or multiple vesicles simultaneously, which are going through either different stages of exocytosis as shown here, or similar stages of exocytosis (Right). (E) An alternative mechanism is possible for explaining doublets and multiplets based on the phenomenon of partial release54–67. A vesicle goes through partial release twice, generating a doublet (Middle); the two individual peaks (Peak 1 and Peak 2) correspond to each partial release event.

