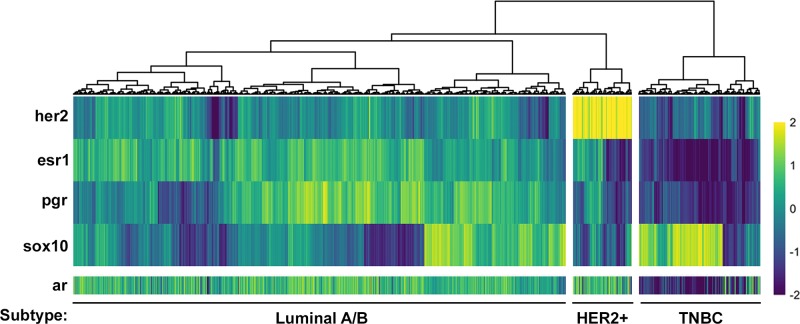
Figure 7. Androgen Receptor expression is inversely correlated with the TNBC marker, Sox10.
AR expression data (z-score of log2 counts) was plotted for each patient sample from an unsupervised clustering of the TCGA dataset using HER2, ESR1, PGR and SOX10 (see Figure 4) to define HER2-positive, Luminal A/B and TNBC subtypes. AR expression values are inversely correlated with SOX10 expression and are lowest in the TNBC subgroup.

