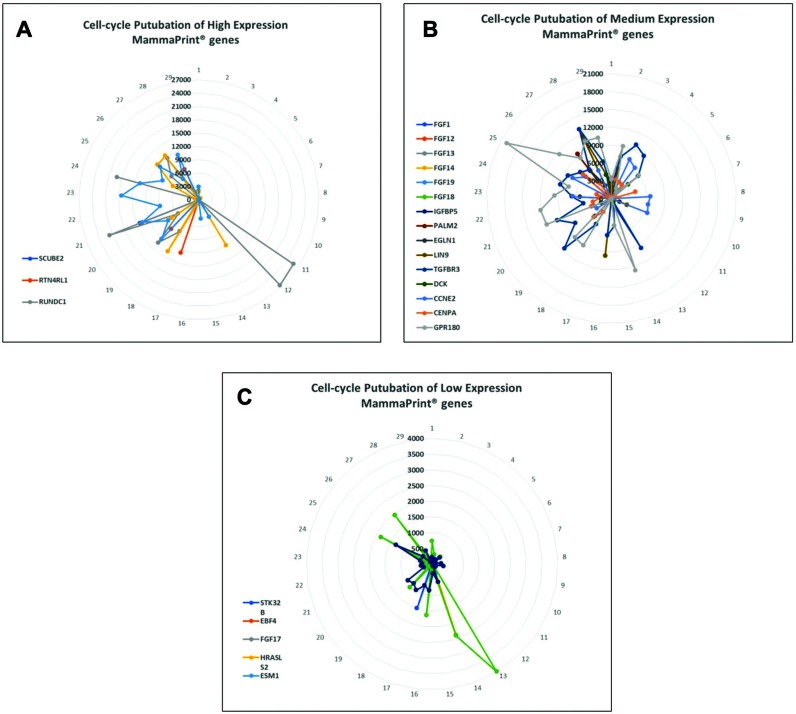
Figure 2. Perturbation of MammaPrint® genes during cell cycle suggests that many MammaPrint® genes are cell cycle regulators.
With microfluidic devices, transcriptomes of individual cells were arranged by similarity to construct a cell cycle map with 29 single-cells with each single-cell represented a specific stage of the cell cycle. The distance between cells represent their similarity with neighboring cells. The map reveals the stepwise perturbations of all genes during the cell cycle, such as G1-phase, S-phase, and G2-phase. The mRNA perturbation of majority of MammaPrint® genes was plotted and presented by expression levels. (A) Highly expression MammaPrint® gene; (B) medium expression MammaPrint® genes and (C) low expression MammaPrint® genes. Genes at all level of expression showed cell-cycle dependent perturbation patterns. These results suggest that majority of MammaPrint® genes are cell cycle regulators and MammaPrint® gene panel is a cell cycle index panel.

