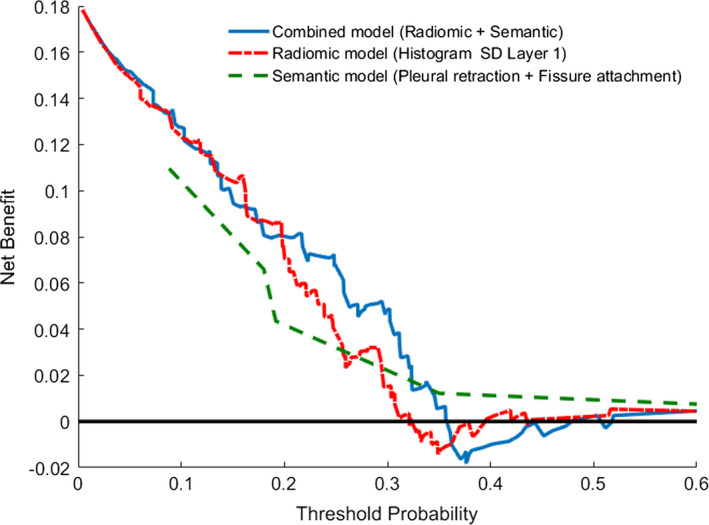
Figure 2.

Decision curve for pathological nodal involvement prediction in clinical N0 peripheral lung adenocarcinomas: Comparison of three models. The y‐axis measures the net benefit. The blue line represents the model with semantic and radiomic features. The red dashed line represents the model with radiomic features. The green dashed line represents the model with semantic features. The black line represents the assumption that no patients have nodal involvement. [Color figure can be viewed at wileyonlinelibrary.com]
