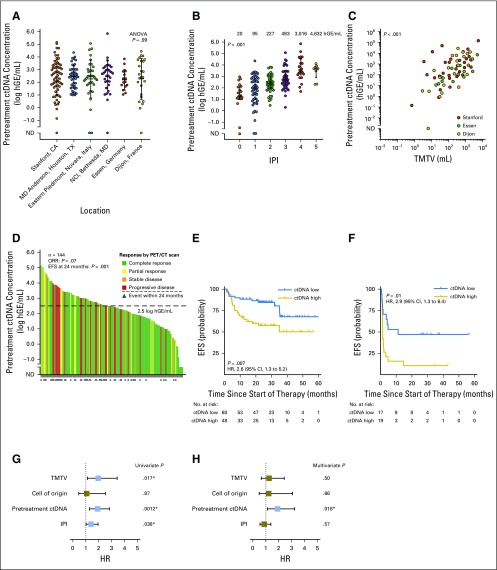
Fig 1.
Pretreatment circulating tumor DNA (ctDNA) is a robust biomarker in diffuse large B-cell lymphoma. (A) Stacked scatter plot of pretreatment ctDNA levels (mean and 95% CI) in study patients across cohorts. Cohort 1 is comprised of patients from Stanford (Stanford, CA), MD Anderson (Houston, TX), and Eastern Piedmont (Novara, Italy); Cohort 2 is comprised of patients from the NCI (Bethesda, MD), Essen University Hospital (Essen, Germany), and Centre Hospitalier Universitaire (Dijon, France) (B) Stacked scatter plot demonstrates the relationship between pretreatment ctDNA levels and International Prognostic Index (IPI). (C) Scatter plot shows the correlation between total metabolic tumor volume (TMTV) and ctDNA concentration. (D) Waterfall plot of pretreatment ctDNA levels (y-axis) for individual patients in cohort 1 (bars) and best responses by positron emission tomography/computed tomography (PET/CT; colors) and event-free survival (EFS) at 24 months (triangles). The threshold best separating patients for EFS is shown by a dashed line. The relationship between pretreatment ctDNA levels and overall response rate (ORR)/EFS at 24 months is also shown (Fisher’s exact test). (E, F) Kaplan-Meier estimates of EFS from the start of therapy for patients in cohort 1 stratified by pretreatment ctDNA levels are shown. (E) EFS in patients receiving front-line anthracycline-based therapy; (F) EFS in patients receiving salvage therapy. (G, H) Results of univariable and multivariable proportional hazards models for EFS are shown in patients with TMTV data available. Full results of the proportional hazards models are shown in Appendix Table A3. ANOVA, analysis of variance; hGE, haploid genome equivalent; HR, hazard ratio; NCI, National Cancer Institute; ND, not detected. (*) Significant.

