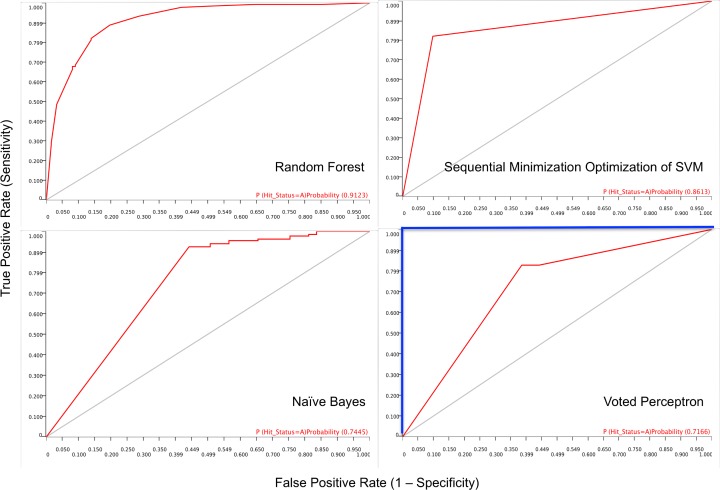
Fig 3. The Receiver operating characteristics (ROC) curve for the four classifier models.
The diagonal grey line represents classifier models that randomly assign compounds to bioactivity class (and will have an area under the curve (AUC) of 0.5). The blue line shown in the ROC curve of Voted perceptron (will have an AUC of 1.0) represents classifier models that perfectly predict bioactivity class of compounds. The red line is the ROC curve from the predictions by the four classifier models. The area under the ROC curve (AUC), a measure of bioactivity class discriminatory power of a classifier model, is shown on each ROC curve.

