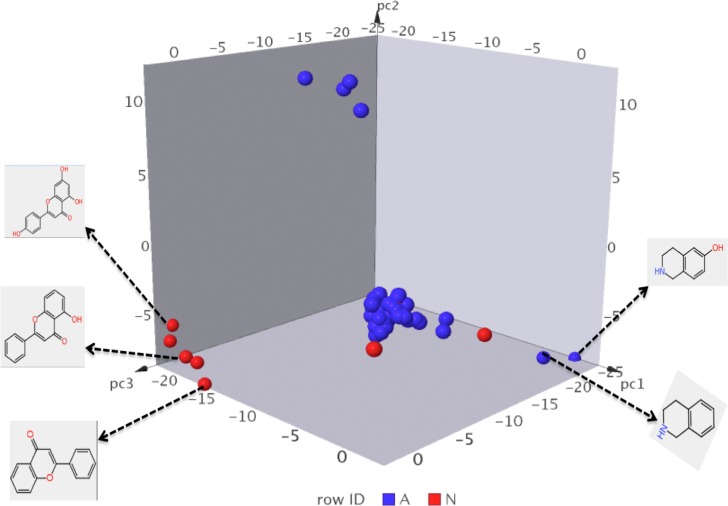
Fig 5. Chemical features from active and inactive compounds from NAA dataset.
The blue markers represent most common substructures from active compounds (IC50 ≤ 10 μM) while the red markers represents most common substructures from inactive compounds (IC50 > 10 μM). The most common substructures were projected in a three-dimension (3D) space based on molecular similarity. Some of the most common substructures that are peculiar to the active and inactive compounds are highlighted. This may guide rational selection and design of active antiplasmodial compounds. NAA: natural products with in-vitro antiplasmodial activity.

