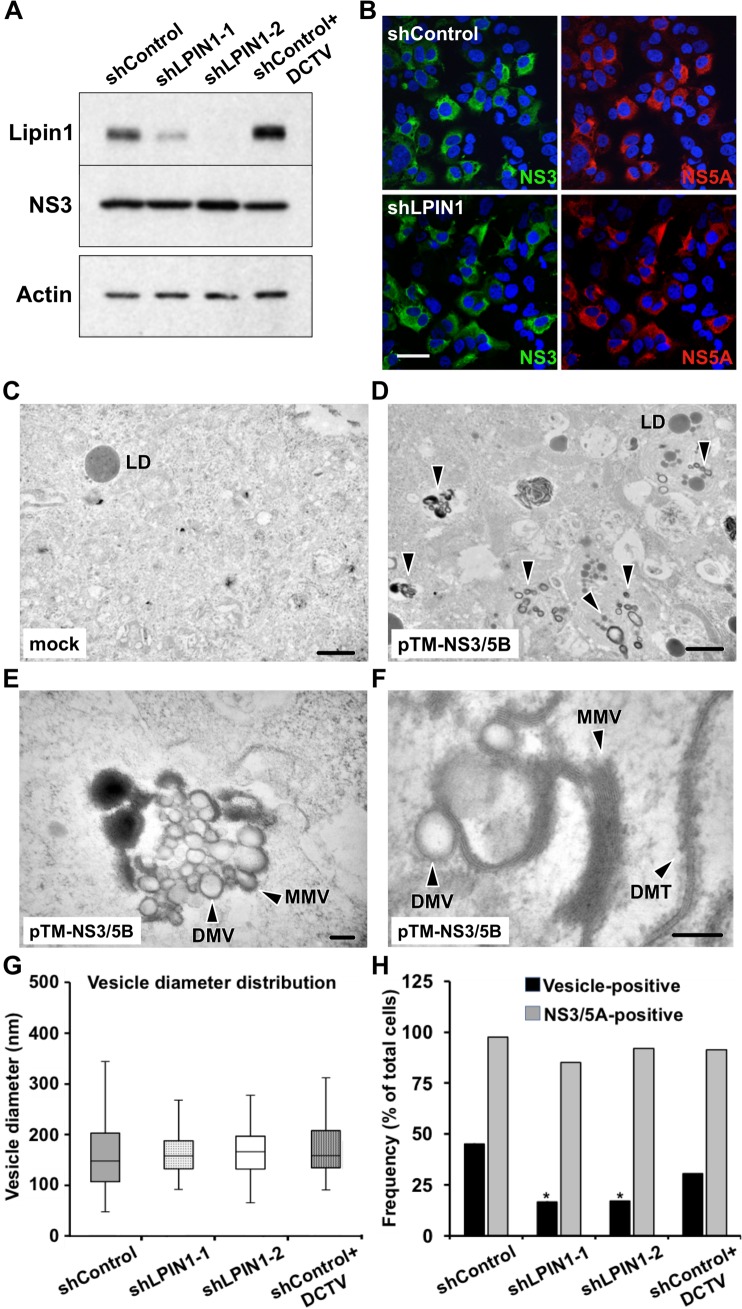
Fig 7. HCV-induced vesicular structure formation is reduced in lipin1-deficient cells.
Huh-7 cells were transduced with lentiviral vectors expressing control or LPIN1-specific shRNAs. HCV polyprotein was expressed in the different cells by vaccinia T7 infection and pTM-NS3/5B plasmid transfection at day 7 post-transduction. Samples were collected 16 hours post-infection for Western Blot, immunofluorescence confocal microscopy and TEM. (A) Polyprotein expression efficiency was determined by Western-Blot using an antibody against NS3 and beta actin as loading control. B- Immunofluorescence microscopy showing comparable transfection efficiency and expression of NS3 and NS5A replicase subunits in control and lipin1-deficient cells. Scale bar 50 μm. Panels C, D- Low magnification TEM images from VacT7-infected, mock-transfected (C) and HCV polyprotein-expressing cells (D). LD, lipid droplet. E, F-Higher magnification images of HCV-polyprotein-expressing cells showing DMV, MMV and DMT structures. Scale bars 1μM (panels C, D), 200 nm (panel E), 100 nm (panel F). G- Whisker plot of HCV vesicle diameter distribution in the different cell lines (shControl n = 279; shLPIN1-1 n = 24; shLPIN1-2 n = 61; shControl+DCTV n = 93). Data were collected from three independent experiments. Box plots represent median and quartiles (Q1 and Q3). Whiskers represent 1.5 interquartile range (IQR) above or below the corresponding quartile. (H) Cells were analyzed by immunofluorescence microscopy to determine the percentage of NS3/NS5A-positive cells (shControl n = 84; shLPIN1-1 n = 115; shLPIN1-2 n = 75; shControl+DCTV n = 122). The same samples were analyzed by TEM to determine the presence/absence of vesicular structures (HCV vesicle-positive) in individual to determine the relative incidence of these structures in the different cell lines (shControl n = 31; shLPIN1-1 n = 36; shLPIN1-2 n = 41; shControl+DCTV n = 42 cells). Data are shown as percentage of total cells. DCTV, daclatasvir 100nM. Statistical significance was determined using Fisher´s Exact Test and Chi Square Test (*p<0.05; **p<0.01).

