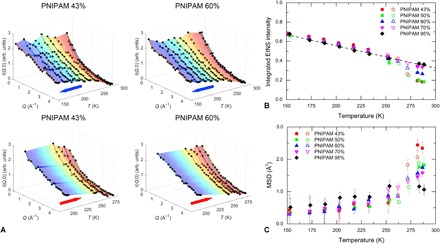
Fig. 1. EINS data.

(A) Incoherent elastic intensities I(Q,0) measured on PNIPAM microgels in D2O with mass fraction concentrations of 43 and 60% as a function of temperature T. Top (bottom) panels report data recorded under cooling (heating). (B) Integral over Q of I(Q,0) as a function of T. The integrated EINS intensities are normalized to 1 for T → 0. (C) Temperature evolution of MSD as obtained using the double-well model (see the Supplementary Materials). In (B) and (C), measurements under cooling are presented with filled symbols, whereas those under heating are presented with open symbols.
