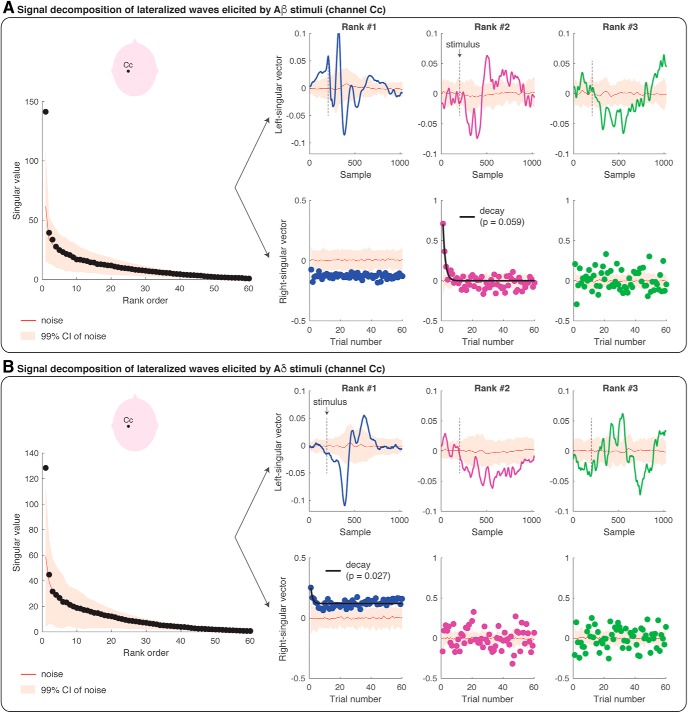
Figure 5.
SVD and modeling of the amplitude modulation of the lateralized waves (at channel Cc) elicited by repeated Aβ (panel A) and Aδ (panel B) stimuli. Each figure panel displays the singular values at each of the 60 ranks, and the left- and right-singular vectors at the first three ranks. The singular values are the scaling factors of left- and right-singular vectors, and they are ranked according to their importance (from the most important to the least important). The left-singular vector shows the modulation of EEG amplitude across the epoch of 1000 ms (i.e., 1024 samples recorded at 1024 Hz). The stimulus onset is marked with a dashed black line. The right-singular vector shows the modulation of EEG amplitude across the 60 trials. The red line in all plots shows the group-average results of the SVD of the single-subject residual noise traces, with a 99% confidence interval for statistical comparison (p = 0.01). Habituation models were fitted to the right-singular vectors at each rank. If a habituation model wins over a non-habituation model, the fit of the model is displayed with a black line superimposed on the right-singular vector values and the corresponding p value is reported. In all the instances in which the non-habituation model wins over a habituation model, no fit is displayed.

