
Figure 6. Differential metabolic profile between young and old optic nerve.
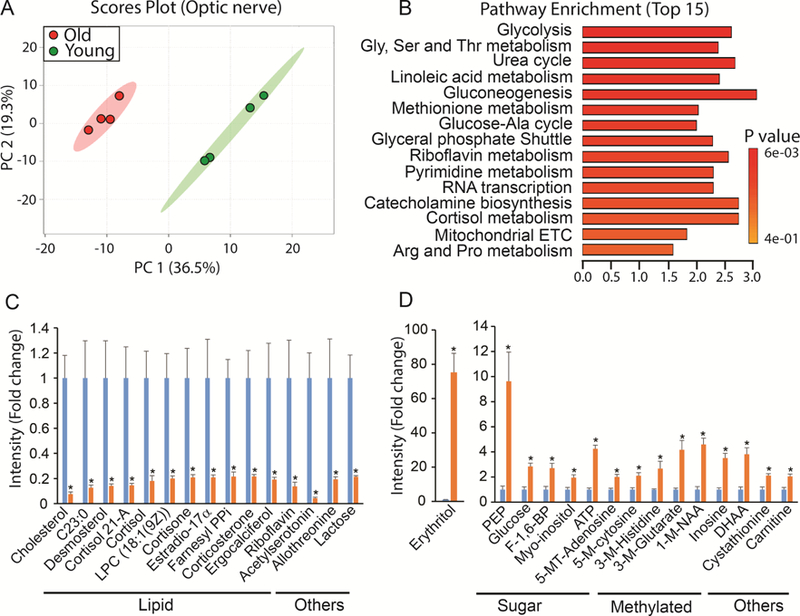
(A) Metabolites from young and old cornea were separated into two different groups in Scores Plot by PCA. (B) Top enriched pathways from the significantly changed metabolites. (C) Top decreased metabolites in the old optic nerve. Farnesyl PPi, Farnesyl pyrophosphate. (D) Top increased metabolites in the old optic nerve. 1- MethylNAA, 1-Methylnicotinamide; 5-MT-Adenosine, 5’-Methylthioadenosine; 5-M-cytosine, 5’- Methylcytosine; 3-M-Histidine, 3-methyl-L-histidine; 3-M-Glutarate, 3-methylglutarate; DHAA, dehydroascorbic acid. Data are fold change of ion intensity of the old vs the young. N=4 from four different animals.