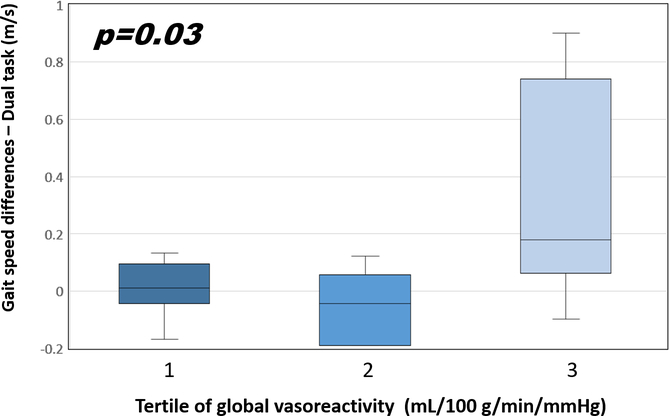
Fig 4.
Changes of gait speed and vasoreactivity.
The gait speed differences show the percent changes in gait speed during DTW between the two-year follow-up and baseline and are stratified by global cerebral vasoreactivity in the diabetic group. Tertile 3 is the highest and the referent tertile. The error bars represent the standard deviation of the vasoreactivity.

