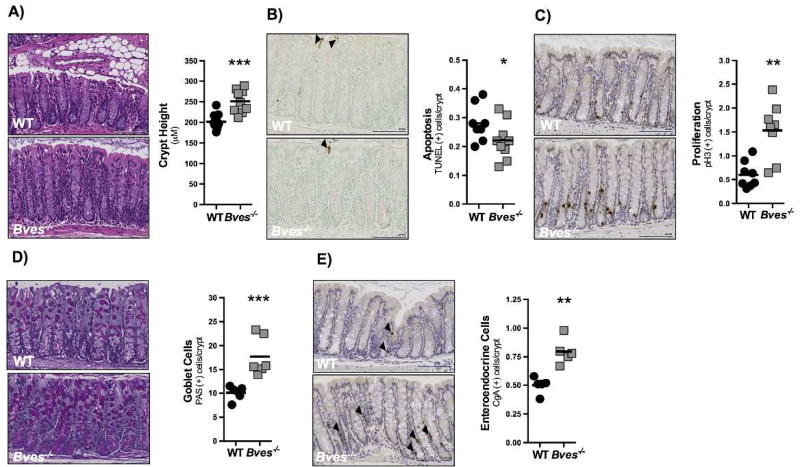
Figure 1. BVES regulates colonic proliferation, lineage allocation, and crypt morphology.
Colons were isolated and Swiss-rolled. (A) Representative H&E staining of sections of WT and Bves−/− colons. Images (left) and quantification (right) of WT and Bves−/− crypt height (201.7 µm vs. 251.2 µm, ***P<0.001, n=10). (B) Images (left) and quantification (right) of apoptotic cells per crypt unit (0.3 vs. 0.2 TUNEL+ cells/crypt, *P=0.05, n=8). (C) Images (left) and quantification (right) of crypt proliferation (0.6 vs. 1.5 phospho-Histone H3+ cells/crypt, **P<0.01, n=8). (D) Images (left) and quantification (right) of goblet cells/crypt (10.1 vs. 17.7 PAS+ cells/crypt, **P<0.01, n=6). (E) Images (left) and quantification (right) of enteroendocrine cells/crypt-villus unit (0.5 vs. 0.8 CgA+ cells/crypt, **P<0.01, n=5). All images were captured at 20× magnification. Black arrows indicate positively-stained cells in (B) and (E). Scale bars are in the bottom right corner of each image and are 100 µM in length.

