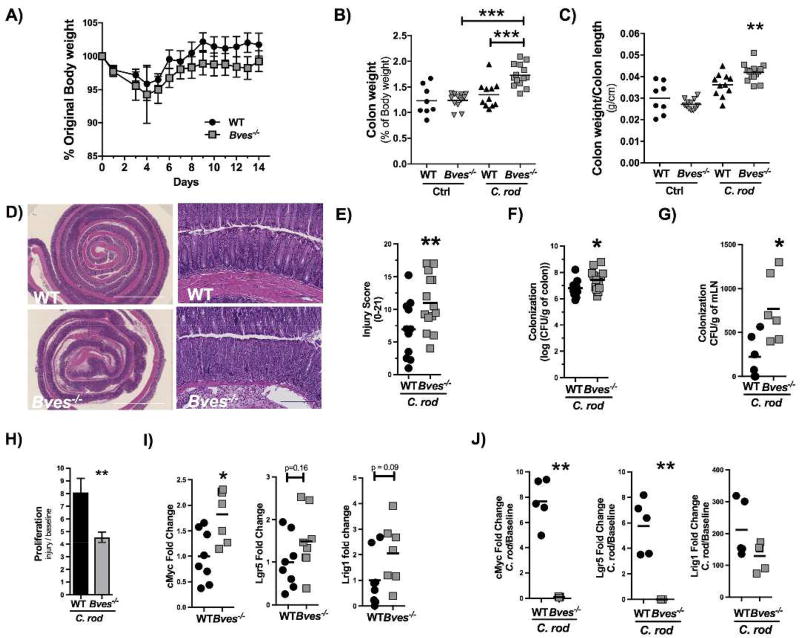
Figure 4. Bves−/− mice demonstrated augmented colitis after infection with Citrobacter rodentium.
WT and Bves−/− mice were infected with C. rodentium and sacrificed 14 days after inoculation. (A) Body weight measured daily for 14 days after inoculation shown as a percentage of starting weight on each day (Bves−/− vs. WT, P = ns, n=8–14). (B) Ratio of colon weight to body weight at the time of sacrifice (Bves−/− C. rod vs. WT C. rod, 1.73 ± 0.06 vs. 1.40 ± 0.08, ***P<0.001, n=8–14). (C) Ratio of colon weight to colon length at the time of sacrifice (Bves−/− vs. WT, 0.04 ± 0.001 vs. 0.03 ± 0.002, ***P<0.001, n=8–14). (D) Representative H&E stained sections of infected WT and Bves−/− mice. Scale bars are pictured in the lower left hand corner. They represent 500 µM for 5× images on left, while they represent 100 µM for the 20× images on the right. (E) Injury scores (Bves−/− vs. WT, 6.9 ± 1.3 vs. 11.0 ± 1.1% **P<0.01, n=11–14). Histological injury score using a multi-point scale as described in the Methods section. (F) Bacterial colonization of colon with C. rodentium quantified as log (CFU/g colon) (Bves−/− vs. WT, 7.4 ± 0.4 vs. 6.8 ± 0.2, *P<0.05, n=8–13). (G) Bacterial colonization of mesenteric lymph nodes (mLNs) calculated as CFU/g mLN (Bves−/− vs. WT, 224 ± 99 vs. 773 ± 156 CFU/g, *P<0.05, n=6). (H) Colonocyte proliferation was calculated as a ratio of the number of pH3 positive stained cells after treatment with C. rodentium divided by number of pH3 positive stained cells at baseline (Bves−/− Injury/Baseline vs. WT Injury/Baseline, 4.5 ± 0.4 vs. 8.1 ± 3.7, **P<0.01, n=11–13). (I) mRNA expression of stem cell markers from colon epithelial isolates at baseline quantified by qPCR: cMyc (Bves−/− vs. WT, 1.8 ± 0.2 vs. 1.0 ± 0.2 fold change, *P<0.05, n=7–8), Lgr5 (Bves−/− vs. WT, 1.5 ± 0.3 vs. 1.0 ± 0.2 P=0.16, n=8) and Lrig1 (Bves−/− vs. WT, 2.1 ± 0.5 vs. 1.0 ± 0.4, P=0.09, n=7–8). (J) After C. rodentium infection, expression of stem cell markers relative to baseline was quantified by qPCR. cMyc (Bves−/− vs. WT, 0.1 ± 0.02 vs. 7.7 ± 0.8 fold change relative to baseline, **P<0.01), Lgr5 (Bves−/− vs. WT, 0.004 ± 0.0005 vs. 5.8 ± 0.9 fold change relative to baseline, **P<0.01), and Lrig1 (Bves−/− vs. WT, 75 ± 20 vs. 212 ± 40 fold change relative to baseline, P=0.42).

