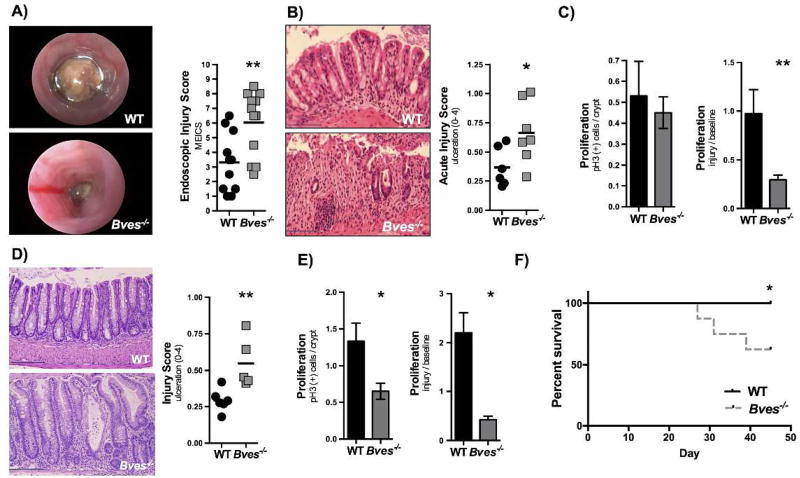
Figure 7. Bves−/− mice demonstrated more severe colitis after DSS treatment.
(A) WT (n=10) and Bves−/− mice (n=13) were treated with 4% DSS for 5 days and then sacrificed. Colonoscopy was performed prior to sacrifice. Colonoscopy videos were scored using MEICS (Bves−/− vs. WT, 6.0 ± 0.6 vs. 3.3 ± 0.6, **P< 0.01, n=10–13). (B) Acute injury scores quantified after sacrifice (Bves−/− vs. WT, 0.7 ± 0.1 vs. 0.4 ± 0.07, *P <0.05, n=6–7). Scale bars are pictured in the lower left hand corner. They represent 100 µM. (C) Left: Proliferation was defined by pH3 positive stained cells/crypt in the WT mice as compared with Bves−/− mice (Bves−/− vs. WT, 0.45 ± 0.08 vs. 0.53 ± 0.2, P=ns, n=7). Right: Proliferation was calculated as a ratio of the number of pH3 positive stained cells after treatment with DSS divided by number of pH3 positive stained cells at baseline (Bves−/− Injury/Baseline vs. WT Injury/Baseline, 0.3 ± 0.05 vs. 1.0 ± 0.2, **P<0.01, n=6–7). (D) Injury-repair model. Mice were treated with 4% DSS for 5 days and then allowed to recover for 5 days. The mice were then sacrificed. There was significantly greater histologic injury in the Bves−/− mice (0.6 ± 0.08 vs. 0.3 ± 0.03, **P<0.01, n=4–5). Scale bars are pictured in the lower left hand corner. They represent 100 µM. (E) Left: Increased proliferation defined by pH3 positive stained cells/crypt in the WT mice as compared with Bves−/− mice (Bves−/− vs. WT, 0.65 ± 0.1 vs. 1.3 ± 0.2, *P<0.05, n=4–5). Right: There was also increased proliferation when compared with mice not treated with DSS (i.e. when compared with baseline proliferation) (Bves−/− Injury/Baseline vs. WT Injury/Baseline, 0.4 ± 0.1 vs. 2.2 ± 0.4, *P<0.05, n=4–5). (F) Survival curves from mice treated with 3 cycles of 4% DSS for 5 days and 10 days of recovery (Bves−/− vs. WT, 62.5% vs. 100%). Survival curves were compared using Log-rank (Mantel-Cox) test. *P<0.05, n=8–9.

