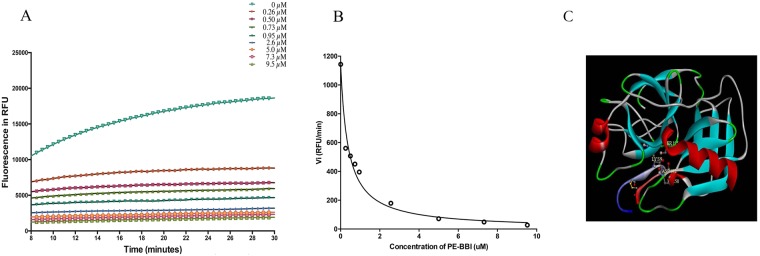
Figure 2.
(A) Dose-dependent PE-BBI curves for trypsin proteolysis inhibitory assay. The x-axis represents time in minutes and the y-axis represents fluorescence intensity. (B) Morrison plots of PE-BBI, the initial rate (vi) values at each concentration of PE-BBI (0.1 to 100 µM). RFU/min (relative fluorescence units/min). (C) Possible interactions model between bovine trypsin protease and PE-BBI. The active site of trypsin (His58, Asp102, and Ser195) and the active site of PE-BBI (Lys9) were performed in stick representation. The disulphide bond of PE-BBI was showed in stick representation (Orange).

