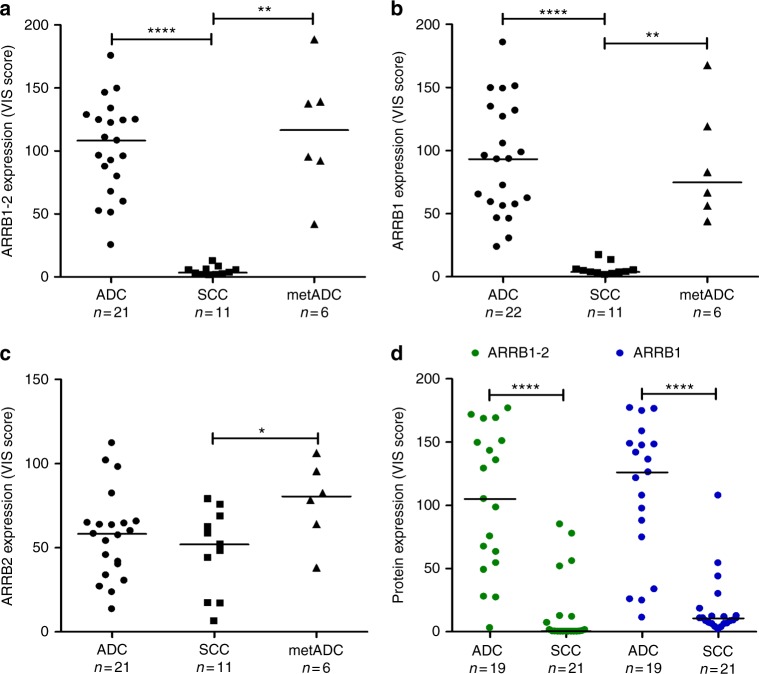
Fig. 1.
Beta-arrestin-1 and 2 protein expression in lung ADC and SCC samples in the in-house and the amsbio TMAs. Scatter plots represent quantitative analysis (VIS score) of IHC results in sections of a–c the in-house TMA and of d the amsbio TMA. Sections of the in-house TMA were incubated with an antibody that (a) recognises both beta-arrestin-1 and 2 (ARRB1-2), or specifically detects either (b) beta-arrestin-1 (ARRB1) or c beta-arrestin-2 (ARRB2). d Sections of the amsbio TMA were incubated with the anti-beta-arrestin-1-2 antibody or with the specific anti-beta-arrestin-1 antibody and “n” indicates the number of subjects in each group. Data points and their median are shown. ****P < 0.0001 **P < 0.01 and *P < 0.05 using Mann–Whitney rank sum test

