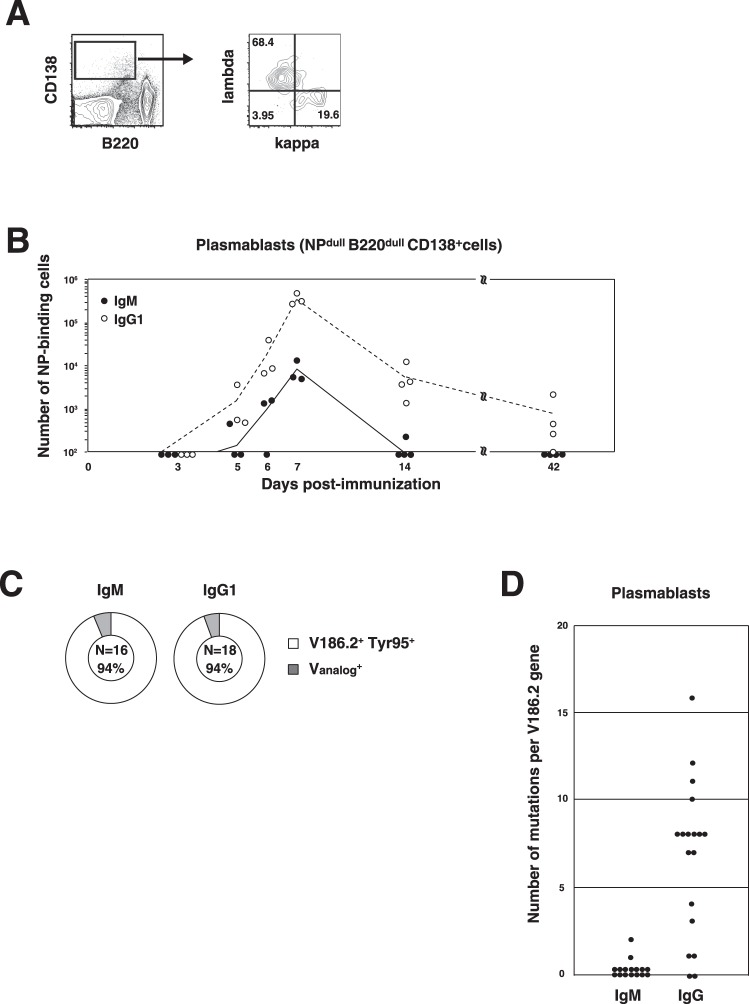
Figure 2.
Comparison of the cell number, VH usage, and SHM frequency between IgM+ and IgG1+ plasmablasts residing in spleens during Phase I and Phase II. (A) Flow cytometry of B220− CD138+ cells in the spleen on day 7 postimmunization with NP40-CGG/alum. The cells were separated based on the expression of Igκ and Igλ. The numbers in the outlined areas indicate the percentages of Igκ+ Igλ− cells (bottom right), Igκ− Igλ+ cells (top left) and Igκ− Igλ− cells (bottom left). (B) Kinetic analysis of the number of IgM+ or IgG1+ plasmablasts with time. (C) Comparison of VH usage between IgM+ and IgG1+ plasmablasts on day 7. (D) Comparison of the SHM frequency per V186.2 gene between IgM+ and IgG1+ plasmablasts in the spleen on day 42 postimmunization. Data were pooled from four independent experiments with one mouse per experiment in Figure (B). Data are from 3–4 independent experiments with one mouse per time point indicated in the figures for each experiment (A–C).

