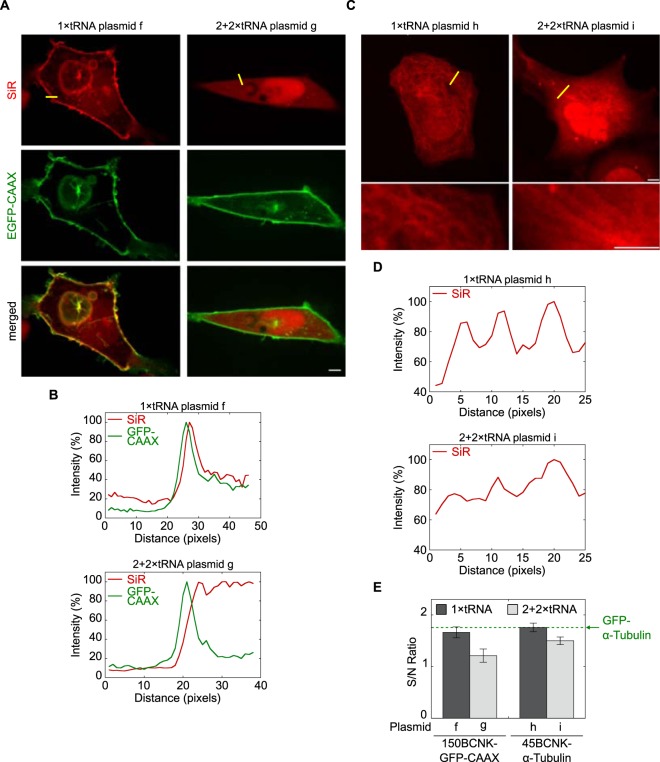
Figure 4.
(A) Live cell imaging of SiR-labelled 150BCNK-EGFP-CAAX expressed in COS7 cells. Top row: red SiR; centre row: green EGFP; bottom row: merge. The scale bar represents 5 μm. (B) Line intensity profiles of 488 and 640 nm channels (EGFP and SiR, respectively) are presented as a percentage of the maximum value and are plotted as a function of distance along a line (yellow line in top panel A). (C) Live-cell imaging of SiR-labelled 45BCNK-α-tubulin expressed in COS7 cells. Zoomed-in images of a subset of the cell are presented below. The scale bar represents 5 μm. (D) Line intensity profiles of 640 nm channel presented as a percentage of the maximum value and plotted as a function of distance along a line (yellow line in top panel C). (E) Signal-to-noise ratios calculated from live-cell images of SiR-labelled 150BCNK-EGFP-CAAX and 45BCNK-α-tubulin expressed in COS7 cells using plasmids carrying 1 or 4 copies of PylT (±SEM). The green dashed line marks the signal-to-noise ratio of GFP-labelled α-tubulin visualized in live COS7 cells under identical conditions.

