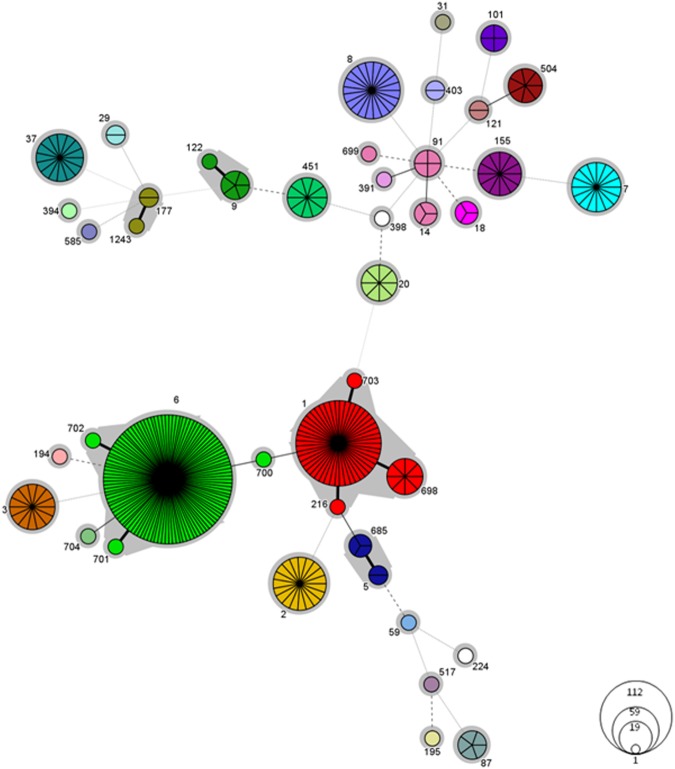
Figure 3.
Minimum spanning tree of MLST data for 344 L. monocytogenes isolates. Each circle represents one ST and the fragment of pie chart corresponds to single isolates. The size of the circle is proportional to the number of isolates with that ST. Gray zones surrounding groups of STs represent CC. The CCs numbers are indicated by gray text for this represented by 10 and more isolates. Connecting lines infer phylogenetic relatedness in terms of number of allelic differences (thick solid, 1; thin solid, 2; dashed, 3; dotted, 4 and above).

