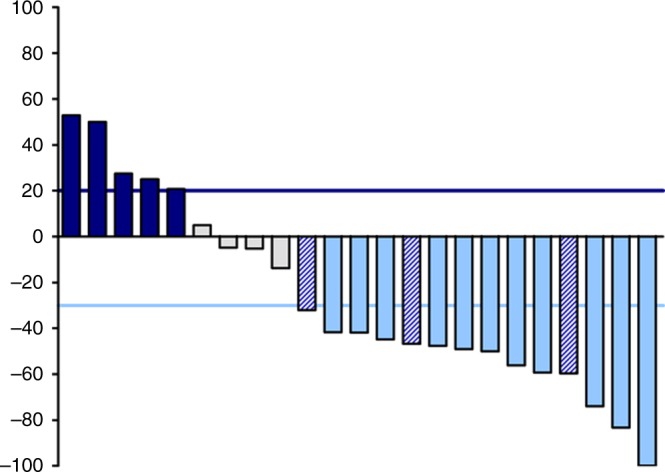
Fig. 1.

Waterfall plot showing maximum percentage change from baseline in tumour size. Grey bars represent patients with a partial or complete response, white bars represent patients with stable disease as best response and black bars represent patients with progressive disease. Grey bars with stripes represent patients with progressive disease due to isolated progression in the brain and >30% decrease in size of the extracerebral lesions. All responses were assessed with RECIST v1.1
