Fig. 3.
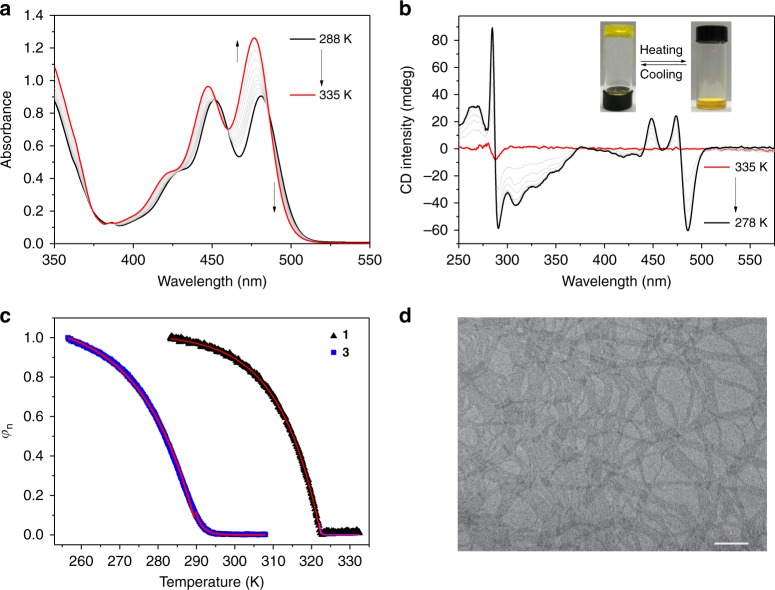
Characterization of supramolecular polymers from 1. a–b Temperature-dependent UV–Vis and CD spectra of 1 (2.00 × 10⁻⁴ M in MCH). Inset of b: thermo-responsive gel–sol transition of 1 (1.00 × 10⁻² M in MCH). c Net helicity φn as a function of temperature for 1 (λ = 486 nm) and 3 (λ = 379 nm) (2.00 × 10⁻⁴ M in MCH). The red and pink lines denote the mathematical fitting. d TEM image by drop-casting 1 (4.00 × 10⁻⁴ M in MCH) on the copper grid. Scale bar: 500 nm

