Fig. 4.
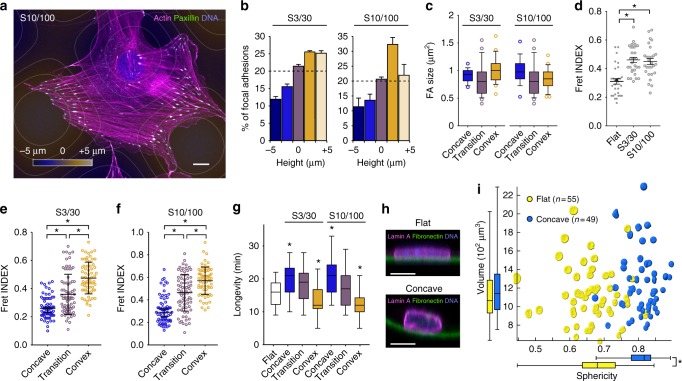
Cell-scale curvature affects focal adhesion organization and nuclear shape. a, b A cell stained for focal adhesions, DNA, and actin (a), and the distribution of focal adhesions according to surface height (b). c–f Impact of surface curvature on focal adhesion size (c), tension (d–f), and longevity (g). h Confocal imaging showing a cross section of the nucleus of mesenchymal stem cells immunostained for Lamin A on flat or concave surfaces labeled with fluorescent fibronectin. i Comparison of volume and sphericity of nuclei from cells growing on flat or concave surfaces (3D reconstructions from confocal data). The actual nuclear shape of each nucleus is displayed on the graph. *Significantly different from control using Student’s t-test with a P value < 0.05. Error bars in b represent the standard error of the mean. Error bars in d–f represent the standard deviation from the mean. Box plot elements in c and g display the minimum, first quartile, median, third quartile, maximum, and the suspected outliers. Scale bars: 10 µm

