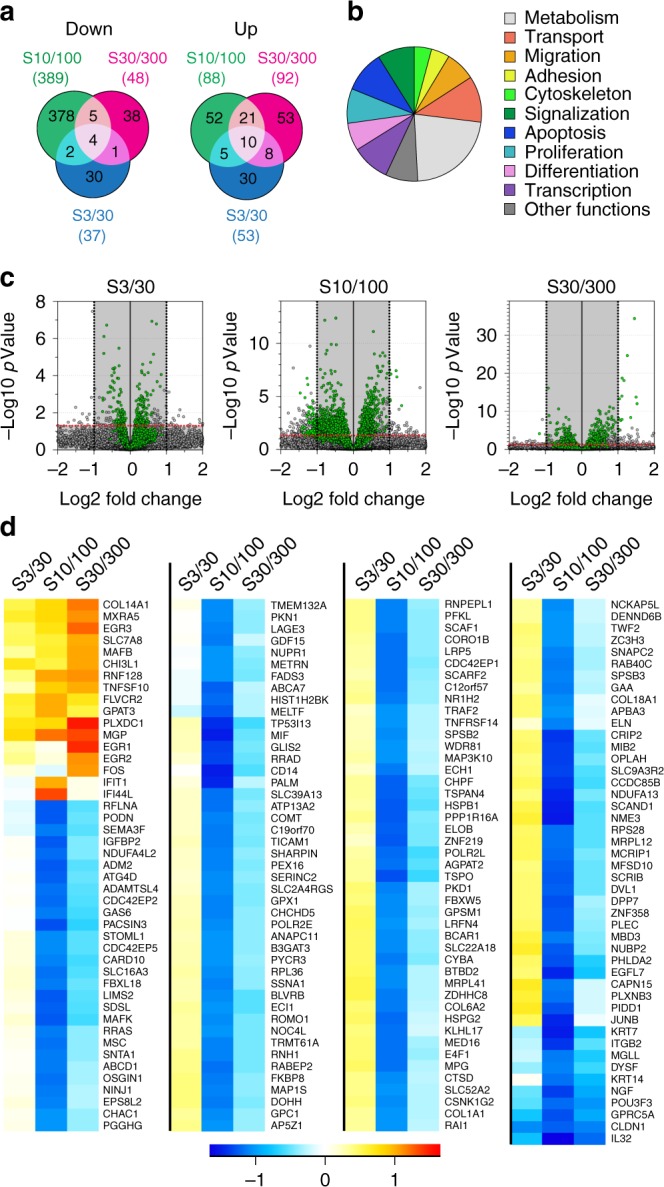
Fig. 6.

Sinusoidal homothetic surfaces have distinct effects on hMSC transcriptome. a Venn diagram representation of the total up- and downregulated genes (P value < 0.05 and Log2FC > 1) on sinusoidal surfaces using flat as reference (637 genes total). b Functional enrichment analysis using GO annotations of biologically described genes (361 genes). c, d Volcano plot of all differentially expressed genes filtering out low expressed genes (gray shaded area, reads < 100) (c), resulting in the identification of 181 genes for which relative expression patterns are shown for the different sinusoidal surfaces (d)
