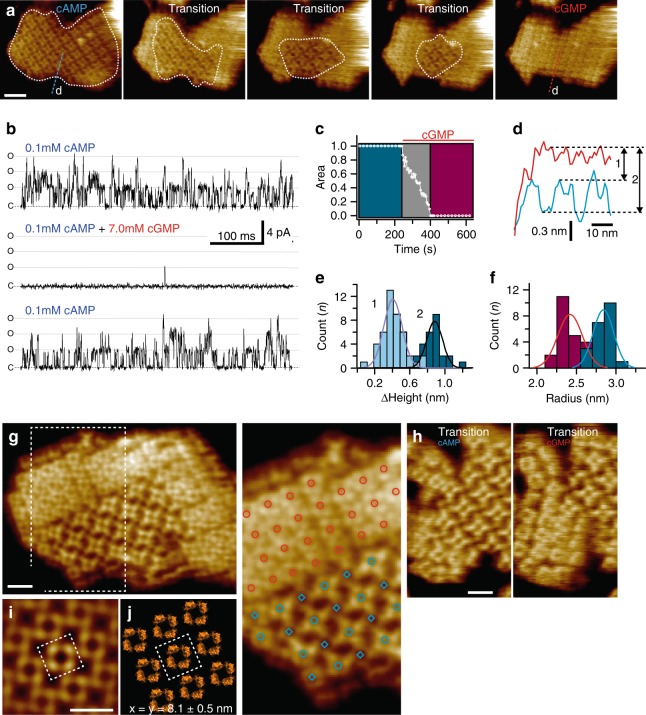
Fig. 3.
Dynamics of ligand-induced conformational changes in SthK by real-time HS-AFM imaging. a HS-AFM time-lapse high-resolution image sequence of a SthK 2D-crystal initially in 0.1 mM cAMP and exposing CNBDs. Upon addition of 7 mM cGMP, SthK channels undergo a conformational change progressively from the borders to the center of the membrane patch (dotted while outline). Scale bar: 30 nm. b Representative electrophysiology traces from SthK channels in the presence of 0.1 mM cAMP (top and bottom traces), and 7 mM cGMP and 0.1 mM cAMP (middle trace). Activity from the same bilayer, perfused to different solutions is displayed to enable direct comparisons. C and O are closed and open channel levels, respectively. Three channels appear active, each with a Po of ~0.25 at 0.1 mM cAMP. c Kinetics of cAMP to cGMP conformational transitions of the 2D-crystal shown in a. d Height profiles along the blue (cAMP) and red (cGMP) dashed lines in a. e Distributions of the relative height differences of the very same molecules in the cGMP conformation and the higher (1) and lower (2) molecules in the cAMP conformation. f Histograms of the radial distance of the cAMP (blue) and cGMP (red) CNBDs from the central four-fold axis. g Left: High-resolution topography of a membrane containing well-ordered channels in both conformations. Right: Zoom into region outlined in g with overlaid red circles for the resting state channels and blue circles (upper molecules) and blue rhomboids (lower molecules) in the activated state. The crystal was imaged in the presence of 0.1 mM cAMP and was one of a handful of membranes that contained resting and activated state molecules simultaneously (scale bar: 10 nm). h High-resolution topographs during a cAMP to cGMP transition where the majority of the molecules are in the cAMP (left) and in the cGMP (right) conformation, respectively (scale bar: 10 nm). i Correlation average of the resting state 2D-crystal in g. Scale bar: 10 nm. j Packing model of the 2D-crystal using the SthK structure (PDB 6CJQ). The unit cell (dashed square in i and j, dimensions a = b = 8.1 nm, γ = 90°), comprises one tetramer

