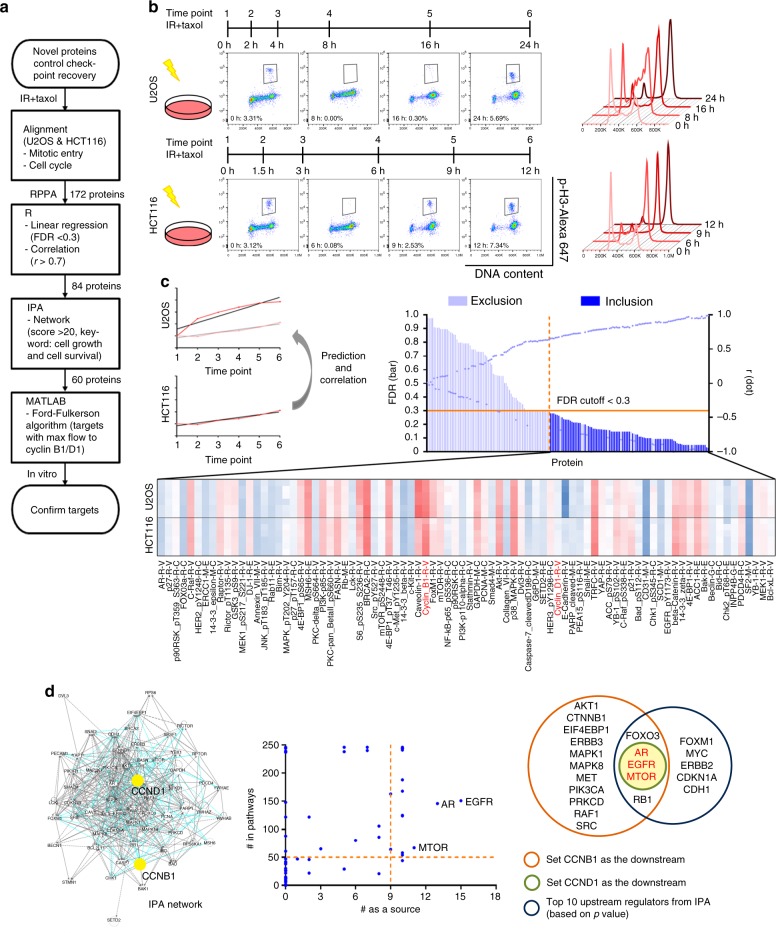
Fig. 1.
mTOR is a candidate for the key molecule regulating G2/M checkpoint recovery. a The flow chart demonstrates the process by which we identified candidates involved in DNA damage recovery from RPPA results. b RPPA was performed in U2OS cells and HCT116 cells. Cells were irradiated with 7 Gy of IR and then were trapped in the mitotic phase using 2 μM paclitaxel for a period of time. Six time points were chosen on the basis of cell cycle patterns and mitotic entry analysis. The percentage of mitotic cells, defined as p-H3-positive cells, is shown in each representative graph. c We used the linear regression slope of each protein in HCT116 cells to predict the same protein expression in U2OS cells and calculate correlations between the two cell lines. Regression equations with a false discovery rate of <0.3 were considered to show a significant linear relationship, and among those proteins, we selected those with a correlation r-value of >0.7 for IPA network analysis. The names in red were two proteins we used as the downstream targets for calculation. d We generated the network in IPA. The scatter plot represents the calculation results based on the Ford-Fulkerson algorithm. The potential upstream targets (words in red) came from the comparison between our calculation results and IPA upstream regulator analysis. FDR false discovery rate, taxol paclitaxel

