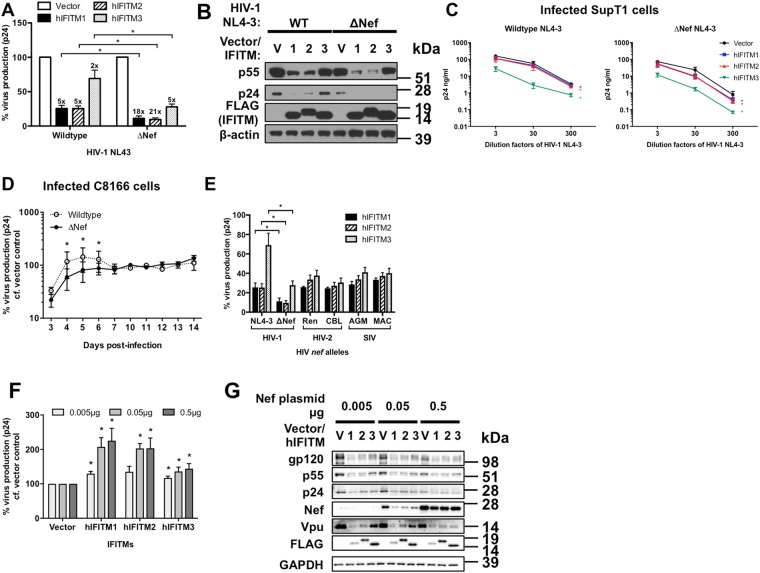
Figure 7.
HIV Nef can help overcome IFITM-mediated restriction of protein synthesis. (A) Level of virus production in HEK293T cells transfected with 0.5 μg expression vectors for IFITMs and 0.5 μg HIV-1 NL4-3 proviral DNA with a deletion (ΔNef) was measured by p24 ELISA 48 hours post-transfection and the data normalized, fold change of virus production compared to vector control is indicated. Differences were assessed with Student’s t tests. (B) Intracellular level of p55/p24 and IFITMs was measured by immunoblotting. (C) SupT1 cells were infected with the indicated dilutions of wild type or Nef-deleted (ΔNef) HIV-1 NL4-3 inoculum and then treated with 1 μg/ml doxycycline to induce IFITM expression post-entry and 5 μM AMD3100 to limit infections to a single round. Level of virus production was measured by p24 ELISA 72 hours post-infection. Differences were assessed with Two-way ANOVA and Bonferroni post-tests. (D) C8166 cells constitutively expressing either vector control or IFITM1 were infected with either wild type or Nef-deleted (ΔNef) HIV-1 NL4-3. Levels of virus production were measured by p24 ELISA at the indicated time-points post-infection and were normalized to the levels of virus produced from vector controls. Differences were assessed with Two-way ANOVA. (E) HEK293T cells were transfected with 0.5 μg expression vectors for IFITMs and 0.5 μg HIV-1 NL4-3 proviral DNA with either wildtype NL4-3 nef or the indicated lentiviral nef alleles. Virus production was measured by p24 ELISA 48 hours post-transfection and the data normalized. Differences were assessed with Student’s t tests. (F) HEK293T cells were transfected with ΔNef HIV-1 NL4-3 proviral DNA, expression vectors for IFITMs and an increasing proportion of HIV-1 Nef-encoding vector versus empty vector in a fixed total quantity of 1 μg. Level of virus production was measured by p24 ELISA 48 hours post-transfection, while levels of viral proteins and IFITM-FLAG expression was analyzed by (G) immunoblotting. Differences were assessed by Student’s t-test. All data show mean + SEM from 3 independent experiments and *denotes p < 0.05.

