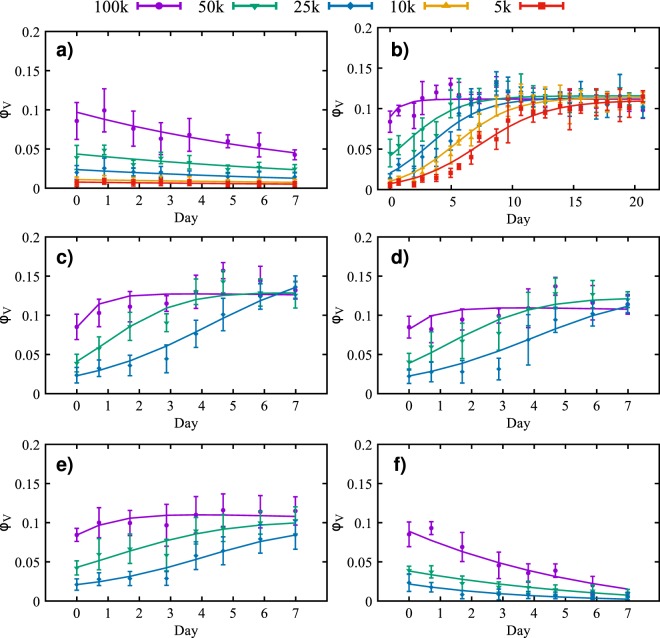
Figure 2.
Time courses for the volume fraction (solid points) and credible interval (the vertical error bars) of viable tumor cell number for different initial cell concentrations: 100,000 (purple), 50,000 (green), 25,000 (blue), 10,000 (orange), and 5,000 (red) cells/ml. The solid lines represent the calibrated model. The data in panel (a) shows the effects of apoptosis after the cells are treated with 10 μg/ml of Mitomycin-C for two hours. The average calibration error, for each initial condition, is between 11.54% and 14.04%. In panel (b) untreated cells in a serum concentration of 10% display an initial growth phase in which the cells reach the carrying capacity. The average calibration error, for each initial condition, is between 7.33% and 23.30%. In panels (c–f) the growth or decline of the tumor cells is observed for different concentrations of nutrient: 7.5% (c), 5% (d), 2.5% (e) and 0% (f). The maximum volume fraction decreases as the initial concentration of nutrient is reduced. The average calibration error, for each condition, is between 8.12% and 31.55%, with the highest error for the 25,000 cells/ml in (f).

