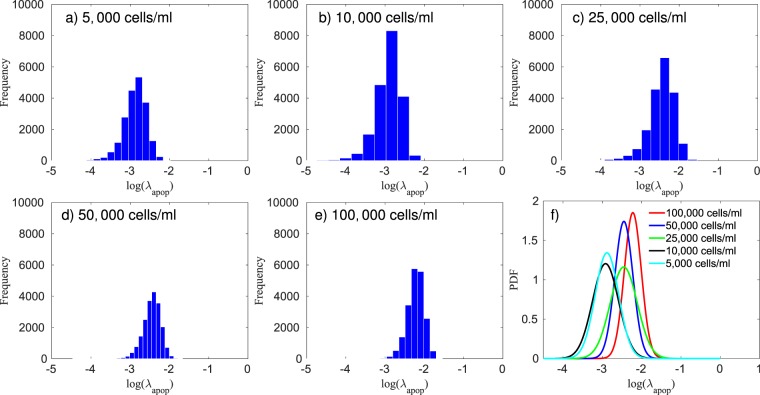
Figure 3.
Histogram of the log of the apoptosis rate and the fitted probability density function (PDF) for five different initial conditions treated with Mitomycin-C at a concentration of 10 μg/ml for two hours. The apoptosis rate is proportional to the initial concentration of cells, with the 5,000 and 10,000 cells/ml (panels a and b, respectively) having the lowest (), the 25,000 and 50,000 cells/ml (panels c and d, respectively) the intermediate ( and , respectively), and the 100,000 cells/ml (e) the highest apoptosis rate ().

