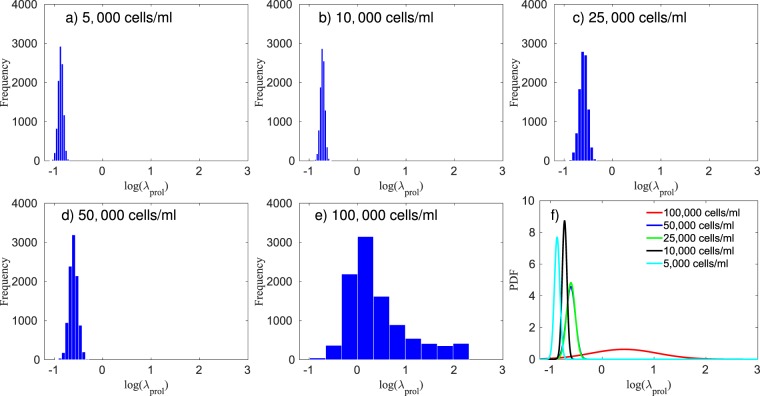
Figure 6.
Panels (a–e) present the histogram of the log of the proliferation rate, , for five different initial conditions, while panel (f) shows the fitted probability density function (PDF) for each of the cases. These data indicate the proliferation rate is proportional to the initial concentration of cells. The 95% equal-tail credibility interval for the proliferation rate, from the lowest initial condition (5,000 cells/ml) to the highest (100,000 cells/ml), is , , , , and , respectively. As the initial condition of the 100,000 cells/ml is close to the carrying capacity, the proliferation rate doesn’t affect the tumor growth after day 3, leading to a significantly wider range on the distribution of .

