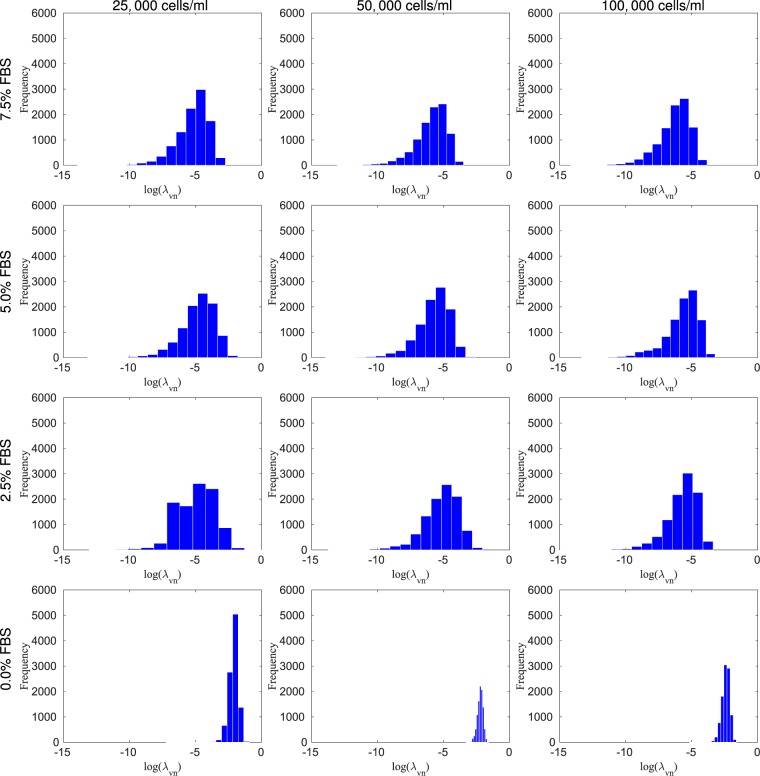
Figure 7.
The histogram of the log of the necrosis rate, , for four FBS concentrations of 7.5%, 5.0%, 2.5%, and 0.0%, from top to bottom, respectively, and three initial conditions, 25,000, 50,000, and 100,000 cells/ml, from right to left, respectively. The necrosis rate increases as the FBS concentration decreases. The panels presenting 2.5%, 5.0%, and 7.5% FBS indicate that there is little to no necrosis for these cases. It is only when the FBS level drops to zero, that evidence of necrosis appears.

