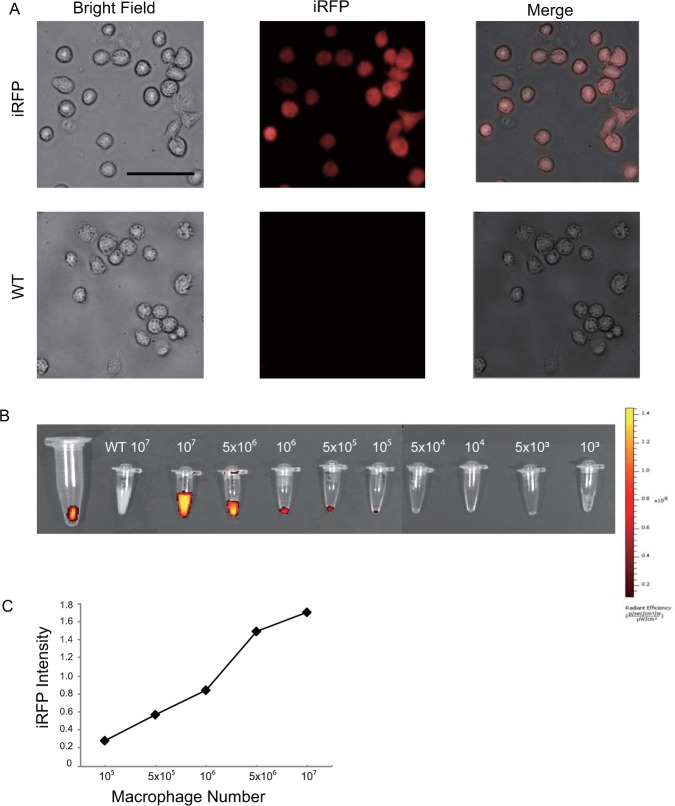
Figure 1.
iRFP TG mouse macrophages express fluorescence in vitro. (A) Peritoneal macrophages from iRFP TG and WT mice observed by fluorescence microscope under a Cy5.5 filter. A clear, fluorescent signal was observed only in the iRFP TG macrophages (scale bar, 50 m). (B) The observed iRFP signal with an augmenting number of iRFP TG mouse peritoneal macrophages in comparison to 1 × 10⁷ WT peritoneal macrophages by the IVIS spectrum under 710 nm and 760 nm excitation and emission wavelengths, respectively. The number of iRFP TG macrophage cells required to emit a detectable iRFP signal by the spectrum IVIS under the above conditions was determined to be 1 × 10⁵ cells. (C) The observed iRFP signal intensity with the corresponding macrophage number. A gradual increase in iRFP signal was observed with increasing cell number. The signal intensity was measured by the Living Image Software.

