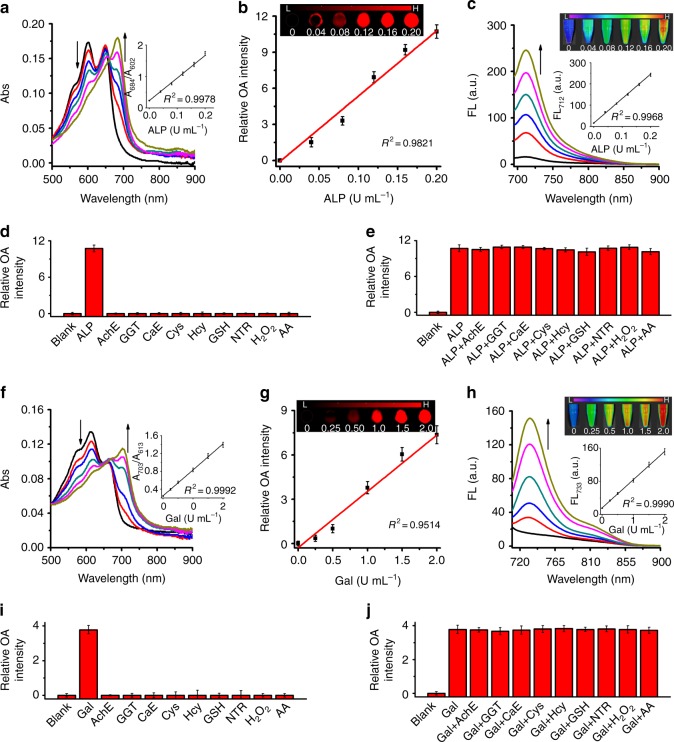
Fig. 2.
Optical responses of C1X-OR1 to ALP and C2X-OR2 to Gal in buffers. a and f Absorption spectra for the probes (5 μM) upon incubation with varied concentrations of corresponding biomarker (0–0.2 U mL−1 for ALP and 0–2 U mL−1 for Gal). The insets show the plots of absorbance ratio vs. biomarker concentration. b and g Optoacoustic response of the probes to corresponding biomarker of varied concentrations (ALP: 0–0.2 U mL−1, Gal: 0–2 U mL−1) (n = 3). The insets show the representative optoacoustic image of the probes in phantom at varied biomarker concentrations (excitation for b and f is 684 nm and 703 nm respectively). c and h Fluorescent spectra for the probes (5 μM) upon incubation with corresponding biomarker of varied concentrations (ALP: 0–0.2 U mL−1, Gal: 0–2 U mL−1). The insets show the plots of fluorescence intensity vs. biomarker concentration. d and i Optoacoustic response of the probes (5 μM) in the presence of 0.2 U mL−1 ALP (1 U mL−1 β-galactosidase) or a potential interference substance. e and j Optoacoustic response of the probes in the presence of ALP (β-galactosidase) and a potential interference substance (n = 3). Error bars represent the standard deviation (SD). Data were represented as mean ± SD

