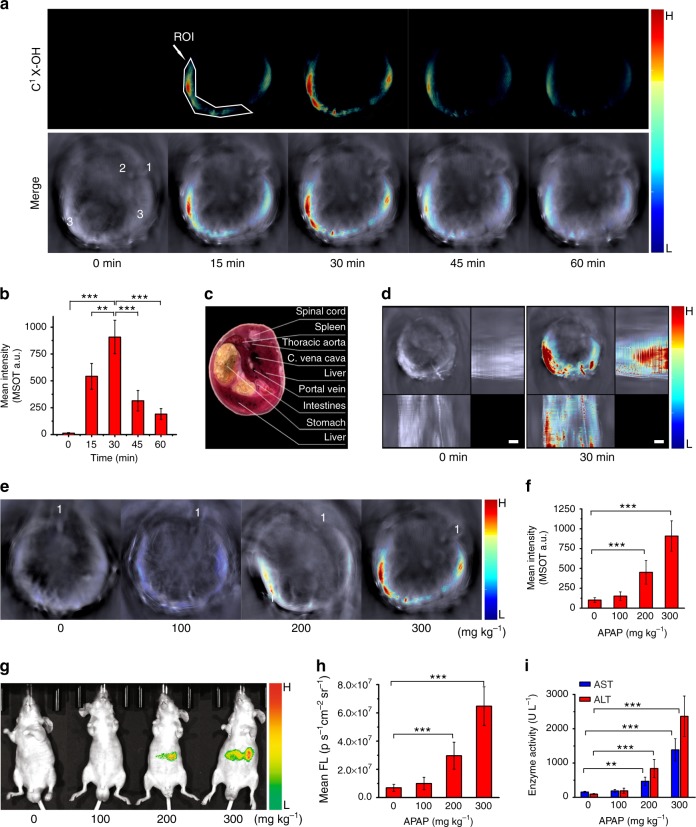
Fig. 3.
Imaging drug-induced liver injury by using C1X-OR1. a Representative cross-sectional MSOT images of a mouse at varied time points upon injection of C1X-OR1. The mouse was pre-treated with 300 mg kg−1 of APAP 12 h in advance. Upper panel: multispectral resolved signal for C1X-OH (activated probe). Lower panel: overlay of C1X-OH’s signal with the grayscale single-wavelength (800 nm) background image. Organ labeling: 1. spinal cord; 2. aorta; 3. liver. The position of spinal cord indicates the mouse lay on its chest with a certain tilt. b Mean optoacoustic intensities at ROI in liver area for the APAP-treated mice at varied time points upon liposomal C1X-OR1 injection (n = 6 per group). c A cryosection image of a male mouse with the cross section’s location comparable to those shown in a. d Representative z-stack orthogonal maximal intensity projection (MIP) images for the mice pretreated with 300 mg kg−1 APAP before and 30 min after injection of the liposomal probe. e Typical cross-sectional MSOT images (with background) of the mice pretreated with varied dose of APAP at 30 min upon probe injection. The images for the probe without background are presented in Supplementary Figure 31a. The spinal cords were labeled with 1 to reflect the mice’s lying position in the chamber. f Mean optoacoustic intensities at ROI in liver area for the mice pretreated with varied dose of APAP (n = 6 per group). g Representative fluorescent images revealing biodistribution of the activated probe for the mice pretreated with varied dose of APAP and injected with the probe. The mice lay on their back during imaging, thus the distribution of fluorescent signal looks different from that of MSOT. h Mean fluorescent intensities at ROI of the mice pretreated with varied dose of APAP (n = 9 per group). i Serum levels of AST and ALT for the mice at 12 h upon treatment with varied dose of APAP (n = 9 per group). The net C1X-OR1 dosage for all imaging is 3.7 mg kg−1. Columns represent means ± SD. The p-values (**p < 0.01, ***p < 0.001) were determined using two-sided Student’s t-test

