Fig. 5.
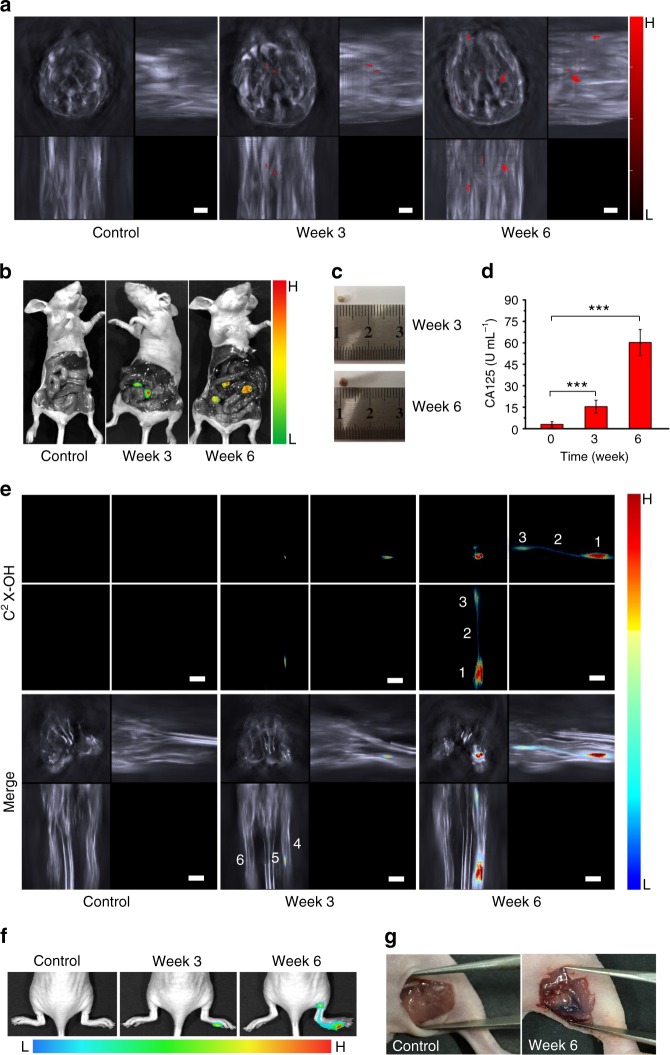
Detecting and positioning metastatic tumors by using probe C2X-OR2. a Representative z-stack orthogonal MIP images of the control group and the mice at 3 or 6 weeks upon injection of ovarian cancer cells (OVCAR3) in abdominal cavity. The images are represented by the volumetric signals of anatomical information in grayscale combined with the activated probe’s signal overlaid in red. b Representative fluorescent images for the dissected control and the mice 3 or 6 weeks upon injection of cancer cells. The mice were the same as the corresponding ones shown in (a). c Picture of a typical tumor collected at 3 or 6 weeks after cancer cell injection. d Serum CA125 level for the mice at 0 (control), 3 or 6 weeks after cancer cell injection (n = 9 per group). e Representative z-stack orthogonal MIP images (for lymphatic metastasis) for the control and the mice at 3 or 6 weeks upon injection of SKOV3 at right hind footpad. Labeling: 1. Primary tumor; 2. Lymph vessel; 3. Sentinel lymph node; 4. Right hind leg; 5. Tail; 6. Left hind leg. The legs were in stretched state during imaging. f Representative fluorescent images for the control and the mice at 3 or 6 weeks upon injection of SKOV3 cells. g Pictures of the control and the mice after 6 weeks post-injection of SKOV3 cells. Skin on popliteal position was removed after euthanasia. The administered dose of C2X-OR2 was 6.4 mg kg−1 for peritoneal injection and 0.64 mg kg−1 for footpad injection. Scale bar: 3 mm. Columns represent means ± SD. The p-values (***p < 0.001) were determined using two-sided Student’s t-test

